Activity 3: Graphing Non-Linear Data Using Logarithmic Scaling 1. Next, consider the data shown in Table 3 below. Using the axes on the next page, plot y (on the vertical axis) vs. x (on the horizontal axis). You should notice that the data points do not form a straight line. Table 3. More Data log(x) log(y) y 198.31 0.71 43.94 1.52 2.13 22.04 2.90 12.08 3.68 7.53 4.27 5.55 5.18 3.78 5.76 3.04 Physics Graphing At-Home Lab y 200 180 + 160 + 140 + 120 + 100 + 80 60 40 + 20 + + + 1 4 5. 6. 8. 2. For each row in Table 3, calculate the log (base-10) of x and the log (base-10) of y. You don't need to show your calculations, just record the results in the table. Then, plot log(y) vs. log(x) on the axes below. log(y) 2.50 2.25 2.00 1.75 1.50 1.25 1.00 + 0.75 + 0.50 0.25 log(x) -0.2 -0.1 0.1 0.2 0.3 0.4 0.5 0.6 0.7 0.8 0.9
Activity 3: Graphing Non-Linear Data Using Logarithmic Scaling 1. Next, consider the data shown in Table 3 below. Using the axes on the next page, plot y (on the vertical axis) vs. x (on the horizontal axis). You should notice that the data points do not form a straight line. Table 3. More Data log(x) log(y) y 198.31 0.71 43.94 1.52 2.13 22.04 2.90 12.08 3.68 7.53 4.27 5.55 5.18 3.78 5.76 3.04 Physics Graphing At-Home Lab y 200 180 + 160 + 140 + 120 + 100 + 80 60 40 + 20 + + + 1 4 5. 6. 8. 2. For each row in Table 3, calculate the log (base-10) of x and the log (base-10) of y. You don't need to show your calculations, just record the results in the table. Then, plot log(y) vs. log(x) on the axes below. log(y) 2.50 2.25 2.00 1.75 1.50 1.25 1.00 + 0.75 + 0.50 0.25 log(x) -0.2 -0.1 0.1 0.2 0.3 0.4 0.5 0.6 0.7 0.8 0.9

College Physics
1st Edition
ISBN:9781938168000
Author:Paul Peter Urone, Roger Hinrichs
Publisher:Paul Peter Urone, Roger Hinrichs
Chapter34: Frontiers Of Physics
Section: Chapter Questions
Problem 22CQ: Must a complex system be adaptive to be of interest in the field of complexity? Give an example to...

Related questions

Question
Hello Sir! Please solve question numbers 1 and 2. Again please solve question numbers 1 and2.
Transcribed Image Text:Activity 3: Graphing Non-Linear Data Using Logarithmic Scaling
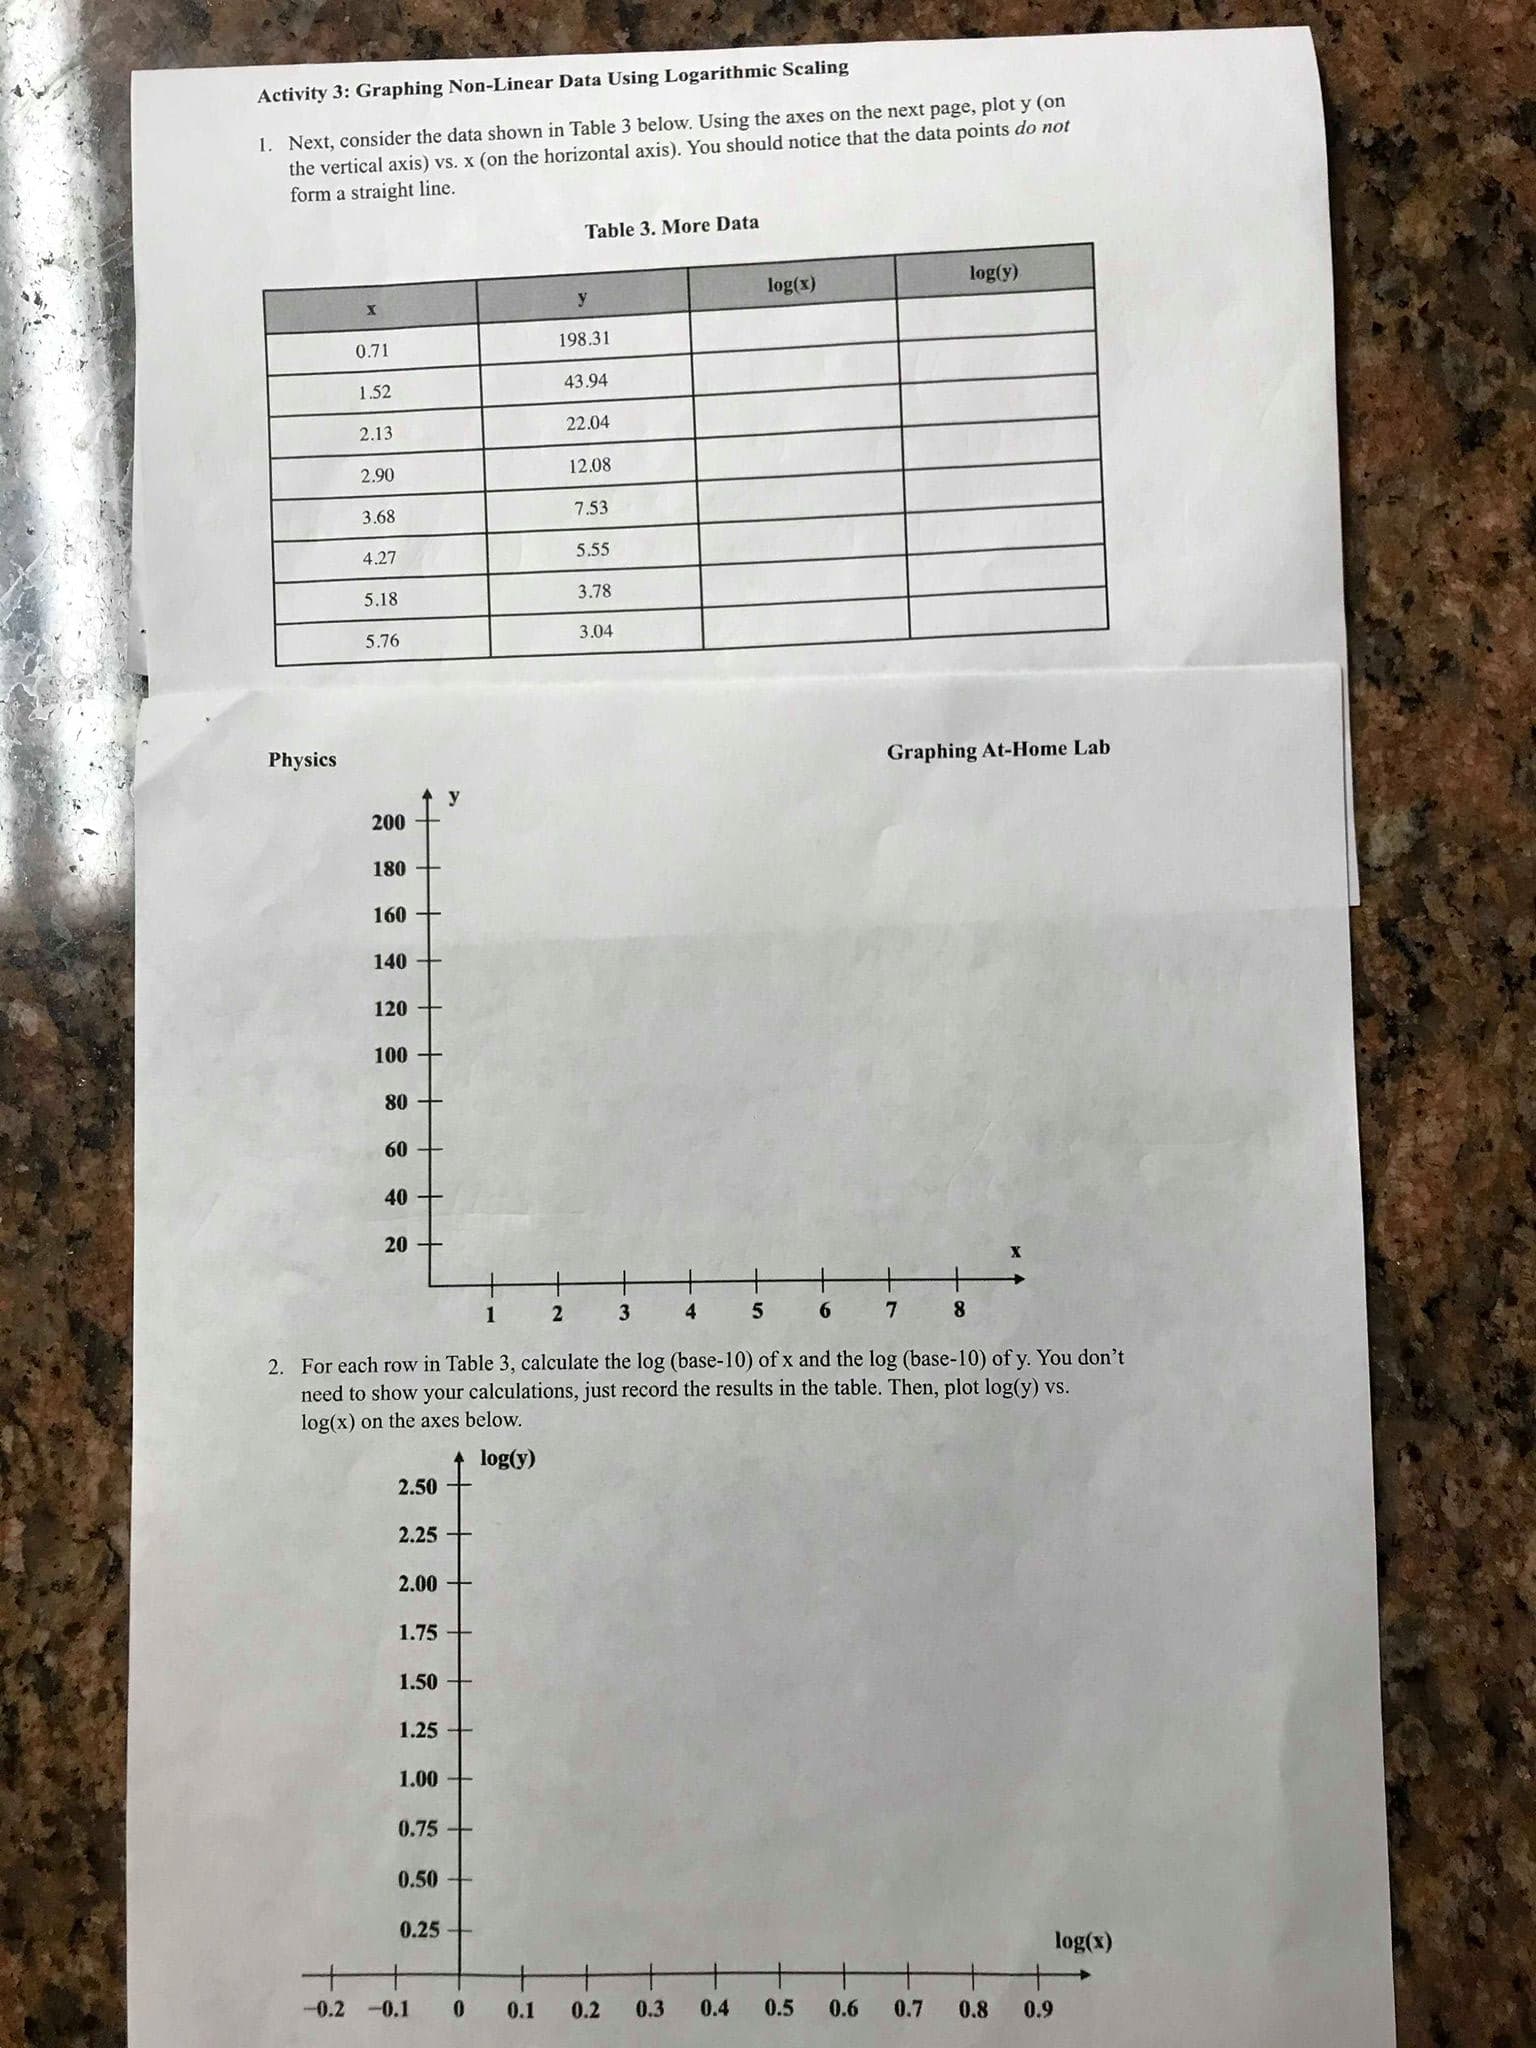
1. Next, consider the data shown in Table 3 below. Using the axes on the next page, plot y (on
the vertical axis) vs. x (on the horizontal axis). You should notice that the data points do not
form a straight line.
Table 3. More Data
log(x)
log(y)
y
198.31
0.71
43.94
1.52
2.13
22.04
2.90
12.08
3.68
7.53
4.27
5.55
5.18
3.78
5.76
3.04
Physics
Graphing At-Home Lab
y
200
180 +
160 +
140 +
120 +
100 +
80
60
40 +
20 +
+
+
1
4
5.
6.
8.
2. For each row in Table 3, calculate the log (base-10) of x and the log (base-10) of y. You don't
need to show your calculations, just record the results in the table. Then, plot log(y) vs.
log(x) on the axes below.
log(y)
2.50
2.25
2.00
1.75
1.50
1.25
1.00 +
0.75 +
0.50
0.25
log(x)
-0.2 -0.1
0.1
0.2
0.3
0.4
0.5
0.6
0.7
0.8
0.9
Expert Solution
This question has been solved!
Explore an expertly crafted, step-by-step solution for a thorough understanding of key concepts.

This is a popular solution!

Trending now
This is a popular solution!

Step by step
Solved in 4 steps with 4 images

Knowledge Booster


Learn more about
Need a deep-dive on the concept behind this application? Look no further. Learn more about this topic, physics and related others by exploring similar questions and additional content below.Recommended textbooks for you
College Physics
Physics
ISBN:
9781938168000
Author:
Paul Peter Urone, Roger Hinrichs
Publisher:
OpenStax College

Glencoe Physics: Principles and Problems, Student…
Physics
ISBN:
9780078807213
Author:
Paul W. Zitzewitz
Publisher:
Glencoe/McGraw-Hill
College Physics
Physics
ISBN:
9781938168000
Author:
Paul Peter Urone, Roger Hinrichs
Publisher:
OpenStax College
Glencoe Physics: Principles and Problems, Student…
Physics
ISBN:
9780078807213
Author:
Paul W. Zitzewitz
Publisher:
Glencoe/McGraw-Hill