ACTIVITY 9 NORMAL DISTRIBUTION Given Area Solution Fi in 1. P (0 < Z < 1.25)

Algebra & Trigonometry with Analytic Geometry
13th Edition
ISBN:9781133382119
Author:Swokowski
Publisher:Swokowski
Chapter10: Sequences, Series, And Probability
Section: Chapter Questions
Problem 9DE

Related questions
Question
Transcribed Image Text:Name
Class Schedule:
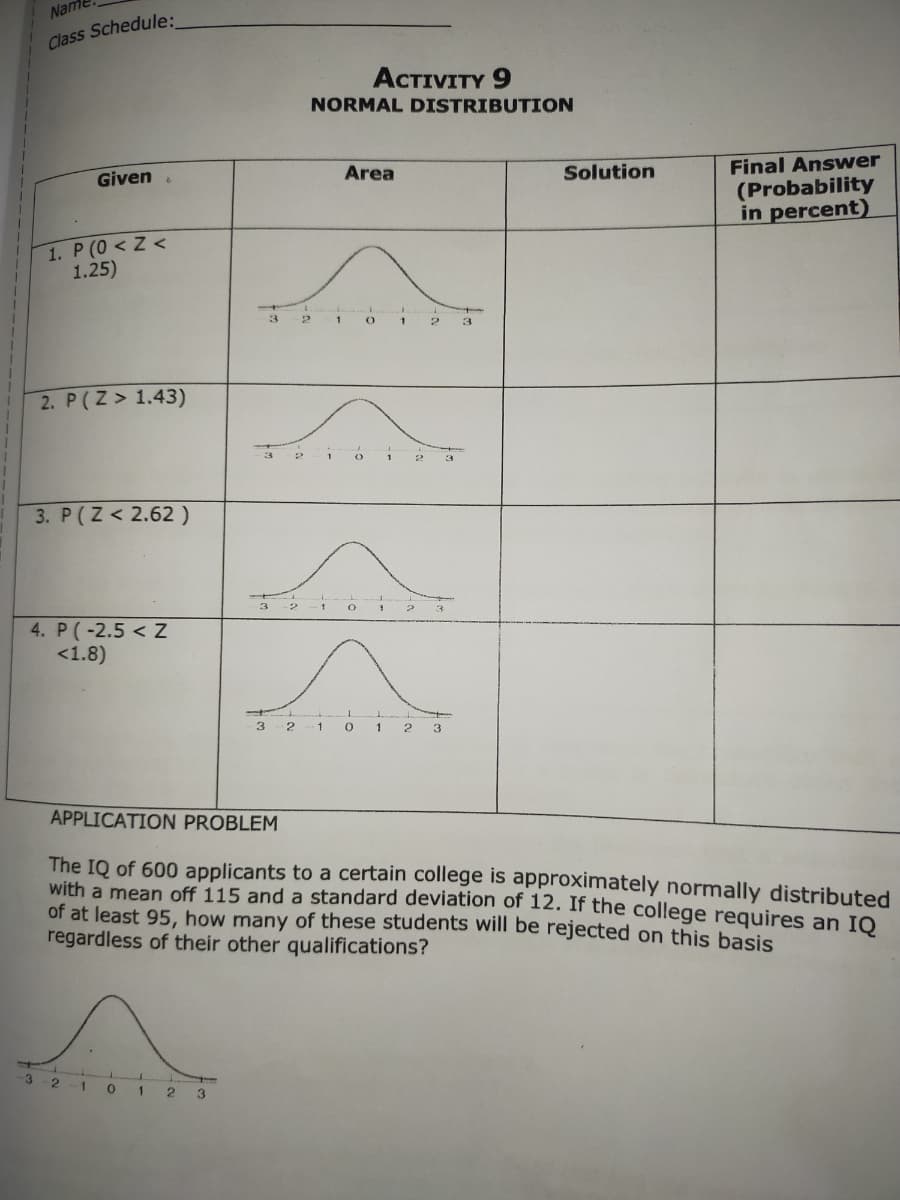
ACTIVITY 9
NORMAL DISTRIBUTION
Area
Solution
Final Answer
Given
(Probability
in percent)
1. P (0< Z <
1.25)
3
- 1
3.
2. P(Z> 1.43)
3. P(Z< 2.62)
4. P(-2.5 < Z
<1.8)
3 2-1
1
2
3
APPLICATION PROBLEM
The IQ of 600 applicants to a certain college is approximately normally distributed
with a mean off 115 and a standard deviation of 12. If the college requires an IO
of at least 95, how many of these students will be rejected on this basis
regardless of their other qualifications?
3
2-1
0 1 2 3
Expert Solution
This question has been solved!
Explore an expertly crafted, step-by-step solution for a thorough understanding of key concepts.

Step by step
Solved in 4 steps with 4 images

Knowledge Booster


Learn more about
Need a deep-dive on the concept behind this application? Look no further. Learn more about this topic, statistics and related others by exploring similar questions and additional content below.Recommended textbooks for you
Algebra & Trigonometry with Analytic Geometry
Algebra
ISBN:
9781133382119
Author:
Swokowski
Publisher:
Cengage
Algebra & Trigonometry with Analytic Geometry
Algebra
ISBN:
9781133382119
Author:
Swokowski
Publisher:
Cengage