ACTIVITY Construct the scatter plot for the following data. Describe the relationship between the variables in terms of form, direction and strength of associations. 1. Number of Siblings (X) and Average Weekly Allowance at School (Y) X 1 4 5 3 6 7 4 2 8 3 Y 120 70 65 100 65 55 75 95 50 90 2. Height (X) and Weight (Y) X (cm) 160 169 161 Y (kg) 62 79 60 163 65 170 82 172 80 165 58 168 78 167 83
ACTIVITY Construct the scatter plot for the following data. Describe the relationship between the variables in terms of form, direction and strength of associations. 1. Number of Siblings (X) and Average Weekly Allowance at School (Y) X 1 4 5 3 6 7 4 2 8 3 Y 120 70 65 100 65 55 75 95 50 90 2. Height (X) and Weight (Y) X (cm) 160 169 161 Y (kg) 62 79 60 163 65 170 82 172 80 165 58 168 78 167 83

Glencoe Algebra 1, Student Edition, 9780079039897, 0079039898, 2018
18th Edition
ISBN:9780079039897
Author:Carter
Publisher:Carter
Chapter10: Statistics
Section10.4: Distributions Of Data
Problem 23PFA

Related questions
Question
Please have the answers on the same format as the solution given in the examples. Thank you.
Transcribed Image Text:EXAMPLES
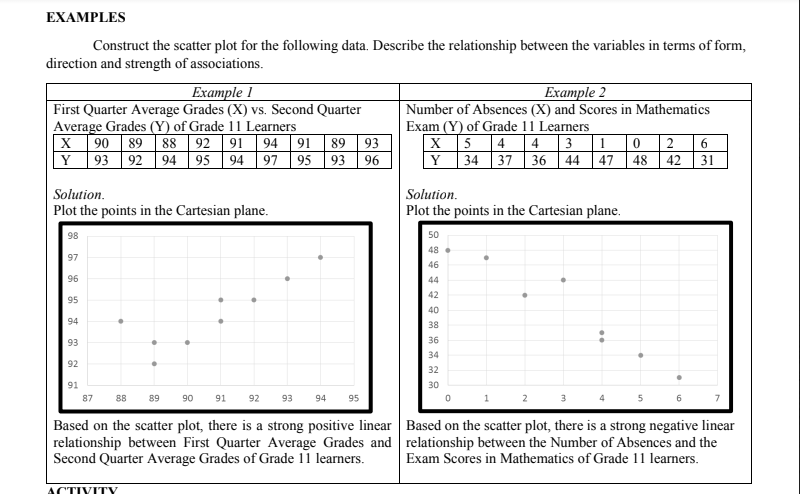
Construct the scatter plot for the following data. Describe the relationship between the variables in terms of form,
direction and strength of associations.
Example 1
Example 2
First Quarter Average Grades (X) vs. Second Quarter
Average Grades (Y) of Grade 11 Learners
Number of Absences (X) and Scores in Mathematics
Exam (Y) of Grade 11 Learners
X 5 4 4 3 1 0
34 37 36 44 | 47 | 48
93
X 90 89 88 92 91 94 91 89
Y 93 92 94 95 94 97 95 93
2 6
42 31
96
Y
Solution.
Solution.
Plot the points in the Cartesian plane.
Plot the points in the Cartesian plane.
98
50
97
48.
46
96
44
42
95
40
94
38
93
36
34
32
92
91
30
87 88 89
90
91 92
93 94 95
Based on the scatter plot, there is a strong positive linear
relationship between First Quarter Average Grades and
Second Quarter Average Grades of Grade 11 learners.
Based on the scatter plot, there is a strong negative linear
relationship between the Number of Absences and the
Exam Scores in Mathematics of Grade 11 learners.
ACTIVITY
m
Transcribed Image Text:ACTIVITY
Construct the scatter plot for the following data. Describe the relationship between the variables in terms of form,
direction and strength of associations.
1. Number of Siblings (X) and Average Weekly Allowance at School (Y)
X
1
4
5
3
6
7
4
2
8
3
Y
120
70
65
100
65
55
75
95
50
90
2. Height (X) and Weight (Y)
X (cm)
160
165
161
Y (kg)
62
58
60
169
79
163
65
170
82
172
80
168
78
167
83
Expert Solution
This question has been solved!
Explore an expertly crafted, step-by-step solution for a thorough understanding of key concepts.

Step by step
Solved in 3 steps with 2 images

Recommended textbooks for you
Glencoe Algebra 1, Student Edition, 9780079039897…
Algebra
ISBN:
9780079039897
Author:
Carter
Publisher:
McGraw Hill

Big Ideas Math A Bridge To Success Algebra 1: Stu…
Algebra
ISBN:
9781680331141
Author:
HOUGHTON MIFFLIN HARCOURT
Publisher:
Houghton Mifflin Harcourt

Holt Mcdougal Larson Pre-algebra: Student Edition…
Algebra
ISBN:
9780547587776
Author:
HOLT MCDOUGAL
Publisher:
HOLT MCDOUGAL
Glencoe Algebra 1, Student Edition, 9780079039897…
Algebra
ISBN:
9780079039897
Author:
Carter
Publisher:
McGraw Hill
Big Ideas Math A Bridge To Success Algebra 1: Stu…
Algebra
ISBN:
9781680331141
Author:
HOUGHTON MIFFLIN HARCOURT
Publisher:
Houghton Mifflin Harcourt
Holt Mcdougal Larson Pre-algebra: Student Edition…
Algebra
ISBN:
9780547587776
Author:
HOLT MCDOUGAL
Publisher:
HOLT MCDOUGAL

Functions and Change: A Modeling Approach to Coll…
Algebra
ISBN:
9781337111348
Author:
Bruce Crauder, Benny Evans, Alan Noell
Publisher:
Cengage Learning