Activity1 "Rolling a Dice" In rolling an unbiased die, what is the average number of spots that would appear? To answer the given queries, let us follow the following steps: Step 2: Determine the Step 3: Multiply each value probability of each possible outcome Probability P(X) Step 1: Identify all possible outcomes time and its respective probability Number of Spots (X) X.P(X) 1 6. 2 6. 3. 4. 6. EX P(X) = = 3.5 Step 4: Find the sum of the products. Step 5: Interpret the result. The value obtained is called the mean of the random variable X or the mean of the probability distribution of X. The mean tells us that the average number of spots that would appear when an unbiased die is rolled is 3.5. This is correct interpretation even though it is impossible to roll a 3.5 on a 6-sided die. This sort of thing often occurs with expected values. There are five (5) steps to be followed in computing the mean of the probability distribution. Step 1: Identify all possible outcomes. Step 2: Determine the probability of each possible outcome. Step 3: Multiply each value and its respective probabilities. Step 4: Find the sum of their products. Step 5: Interpret the result. 11611611161161 6116
Activity1 "Rolling a Dice" In rolling an unbiased die, what is the average number of spots that would appear? To answer the given queries, let us follow the following steps: Step 2: Determine the Step 3: Multiply each value probability of each possible outcome Probability P(X) Step 1: Identify all possible outcomes time and its respective probability Number of Spots (X) X.P(X) 1 6. 2 6. 3. 4. 6. EX P(X) = = 3.5 Step 4: Find the sum of the products. Step 5: Interpret the result. The value obtained is called the mean of the random variable X or the mean of the probability distribution of X. The mean tells us that the average number of spots that would appear when an unbiased die is rolled is 3.5. This is correct interpretation even though it is impossible to roll a 3.5 on a 6-sided die. This sort of thing often occurs with expected values. There are five (5) steps to be followed in computing the mean of the probability distribution. Step 1: Identify all possible outcomes. Step 2: Determine the probability of each possible outcome. Step 3: Multiply each value and its respective probabilities. Step 4: Find the sum of their products. Step 5: Interpret the result. 11611611161161 6116

Functions and Change: A Modeling Approach to College Algebra (MindTap Course List)
6th Edition
ISBN:9781337111348
Author:Bruce Crauder, Benny Evans, Alan Noell
Publisher:Bruce Crauder, Benny Evans, Alan Noell
Chapter5: A Survey Of Other Common Functions
Section5.6: Higher-degree Polynomials And Rational Functions
Problem 5E: Population Genetics In the study of population genetics, an important measure of inbreeding is the...

Related questions
Question
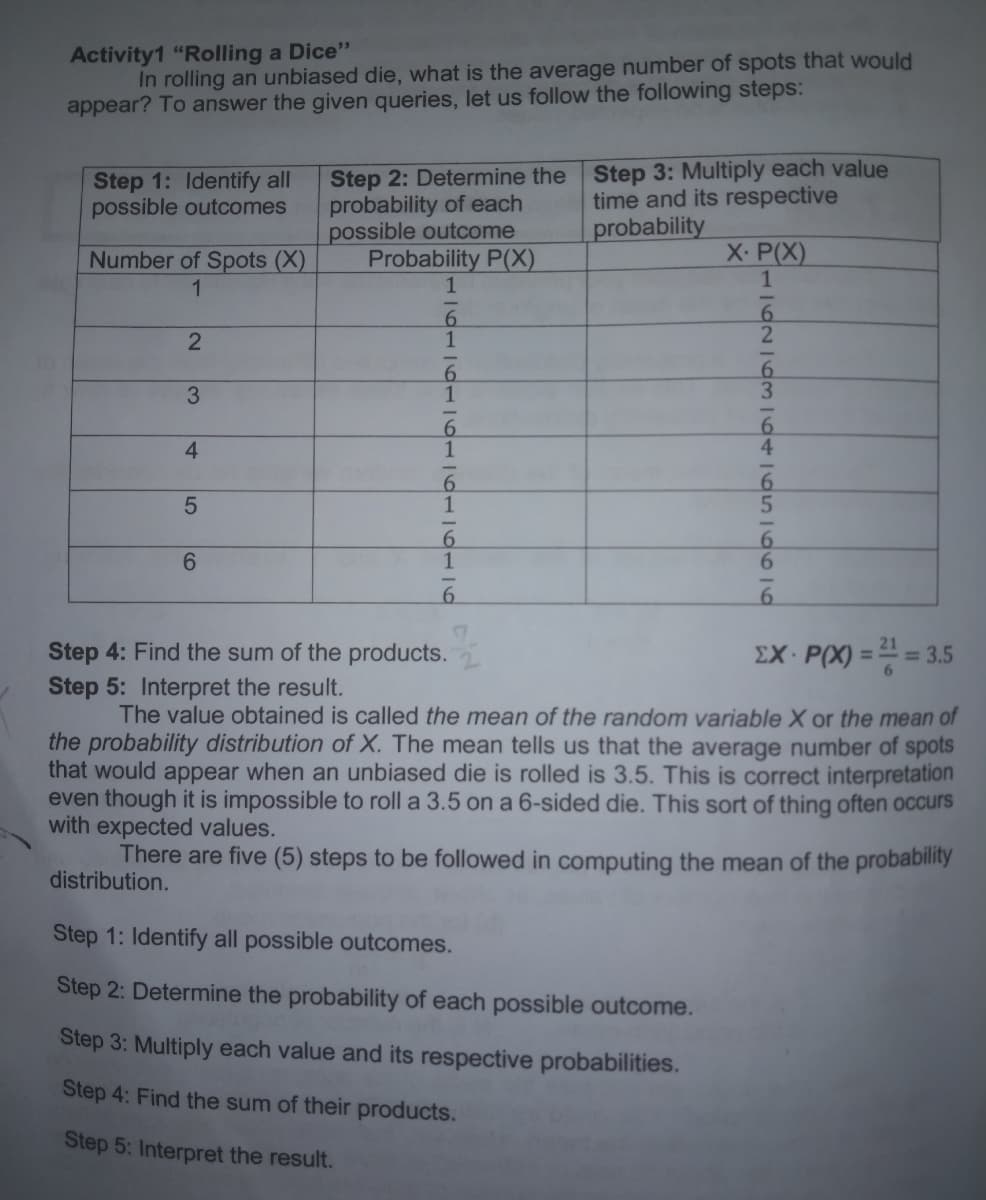
Transcribed Image Text:Activity1 "Rolling a Dice"
In rolling an unbiased die, what is the average number of spots that would
appear? To answer the given queries, let us follow the following steps:
Step 2: Determine the Step 3: Multiply each value
probability of each
possible outcome
Probability P(X)
Step 1: Identify all
possible outcomes
time and its respective
probability
Number of Spots (X)
X. P(X)
1
1
1
4
6.
6.
Step 4: Find the sum of the products.
Step 5: Interpret the result.
The value obtained is called the mean of the random variable X or the mean of
the probability distribution of X. The mean tells us that the average number of spots
that would appear when an unbiased die is rolled is 3.5. This is correct interpretation
even though it is impossible to roll a 3.5 on a 6-sided die. This sort of thing often occurs
with expected values.
There are five (5) steps to be followed in computing the mean of the probability
distribution.
EX· P(X) = = 3.5
%3D
Step 1: Identify all possible outcomes.
Step 2: Determine the probability of each possible outcome.
Step 3: Multiply each value and its respective probabilities.
Step 4: Find the sum of their products.
Step 5: Interpret the result.
191161 6116116116
Expert Solution
This question has been solved!
Explore an expertly crafted, step-by-step solution for a thorough understanding of key concepts.

This is a popular solution!

Trending now
This is a popular solution!

Step by step
Solved in 3 steps

Knowledge Booster


Learn more about
Need a deep-dive on the concept behind this application? Look no further. Learn more about this topic, statistics and related others by exploring similar questions and additional content below.Recommended textbooks for you
Functions and Change: A Modeling Approach to Coll…
Algebra
ISBN:
9781337111348
Author:
Bruce Crauder, Benny Evans, Alan Noell
Publisher:
Cengage Learning

Algebra & Trigonometry with Analytic Geometry
Algebra
ISBN:
9781133382119
Author:
Swokowski
Publisher:
Cengage
Functions and Change: A Modeling Approach to Coll…
Algebra
ISBN:
9781337111348
Author:
Bruce Crauder, Benny Evans, Alan Noell
Publisher:
Cengage Learning
Algebra & Trigonometry with Analytic Geometry
Algebra
ISBN:
9781133382119
Author:
Swokowski
Publisher:
Cengage