Addai Company has provided the following comparative information: 20Y8 20Y7 20Y6 20Y5 20Y4 Net income $273,406 $367,976 $631,176 $884,000 $800,000 Interest expense 616,047 572,003 528,165 495,000 440,000 Income tax expense 31,749 53,560 106,720 160,000 200,000 Total assets (ending balance) 4,417,178 4,124,350 3,732,443 3,338,500 2,750,000 Total stockholders’ equity (ending balance) 3,706,557 3,433,152 3,065,176 2,434,000 1,550,000 Average total assets 4,270,764 3,928,396 3,535,472 3,044,250 2,475,000 Average total stockholders' equity 3,569,855 3,249,164 2,749,588 1,992,000 1,150,000 You have been asked to evaluate the historical performance of the company over the last five years. Selected industry ratios have remained relatively steady at the following levels for the last five years: 20Y4–20Y8 Return on total assets 28% Return on stockholders’ equity 18% Times interest earned 2.7 Ratio of liabilities to stockholders’ equity 0.4 Required: 1. Determine the following for the years 20Y4 through 20Y8 for each of the graphs below. Use the amounts given above in your calculations. Round to one decimal place: a. Return on total assets:
Addai Company has provided the following comparative information: 20Y8 20Y7 20Y6 20Y5 20Y4 Net income $273,406 $367,976 $631,176 $884,000 $800,000 Interest expense 616,047 572,003 528,165 495,000 440,000 Income tax expense 31,749 53,560 106,720 160,000 200,000 Total assets (ending balance) 4,417,178 4,124,350 3,732,443 3,338,500 2,750,000 Total stockholders’ equity (ending balance) 3,706,557 3,433,152 3,065,176 2,434,000 1,550,000 Average total assets 4,270,764 3,928,396 3,535,472 3,044,250 2,475,000 Average total stockholders' equity 3,569,855 3,249,164 2,749,588 1,992,000 1,150,000 You have been asked to evaluate the historical performance of the company over the last five years. Selected industry ratios have remained relatively steady at the following levels for the last five years: 20Y4–20Y8 Return on total assets 28% Return on stockholders’ equity 18% Times interest earned 2.7 Ratio of liabilities to stockholders’ equity 0.4 Required: 1. Determine the following for the years 20Y4 through 20Y8 for each of the graphs below. Use the amounts given above in your calculations. Round to one decimal place: a. Return on total assets:

Survey of Accounting (Accounting I)
8th Edition
ISBN:9781305961883
Author:Carl Warren
Publisher:Carl Warren
Chapter15: Capital Investment Analysis
Section: Chapter Questions
Problem 15.2.1MBA

Related questions
Question
Solvency and Profitability Trend Analysis
Addai Company has provided the following comparative information:
| 20Y8 | 20Y7 | 20Y6 | 20Y5 | 20Y4 | ||||||
| Net income | $273,406 | $367,976 | $631,176 | $884,000 | $800,000 | |||||
| Interest expense | 616,047 | 572,003 | 528,165 | 495,000 | 440,000 | |||||
| Income tax expense | 31,749 | 53,560 | 106,720 | 160,000 | 200,000 | |||||
| Total assets (ending balance) | 4,417,178 | 4,124,350 | 3,732,443 | 3,338,500 | 2,750,000 | |||||
| Total |
3,706,557 | 3,433,152 | 3,065,176 | 2,434,000 | 1,550,000 | |||||
| Average total assets | 4,270,764 | 3,928,396 | 3,535,472 | 3,044,250 | 2,475,000 | |||||
| Average total stockholders' equity | 3,569,855 | 3,249,164 | 2,749,588 | 1,992,000 | 1,150,000 |
You have been asked to evaluate the historical performance of the company over the last five years.
Selected industry ratios have remained relatively steady at the following levels for the last five years:
| 20Y4–20Y8 | ||
| Return on total assets | 28% | |
| Return on stockholders’ equity | 18% | |
| Times interest earned | 2.7 | |
| Ratio of liabilities to stockholders’ equity | 0.4 |
Required:
1. Determine the following for the years 20Y4 through 20Y8 for each of the graphs below. Use the amounts given above in your calculations. Round to one decimal place:
a. Return on total assets:
| 20Y8 | fill in the blank 1 % |
| 20Y7 | fill in the blank 2 % |
| 20Y6 | fill in the blank 3 % |
| 20Y5 | fill in the blank 4 % |
| 20Y4 | fill in the blank 5 % |
b. Return on stockholders' equity:
| 20Y8 | fill in the blank 6 % |
| 20Y7 | fill in the blank 7 % |
| 20Y6 | fill in the blank 8 % |
| 20Y5 | fill in the blank 9 % |
| 20Y4 | fill in the blank 10 % |
c. Times interest earned:
| 20Y8 | fill in the blank 11 |
| 20Y7 | fill in the blank 12 |
| 20Y6 | fill in the blank 13 |
| 20Y5 | fill in the blank 14 |
| 20Y4 | fill in the blank 15 |
d. Ratio of liabilities to stockholders' equity:
| 20Y8 | fill in the blank 16 |
| 20Y7 | fill in the blank 17 |
| 20Y6 | fill in the blank 18 |
| 20Y5 | fill in the blank 19 |
| 20Y4 | fill in the blank 20 |
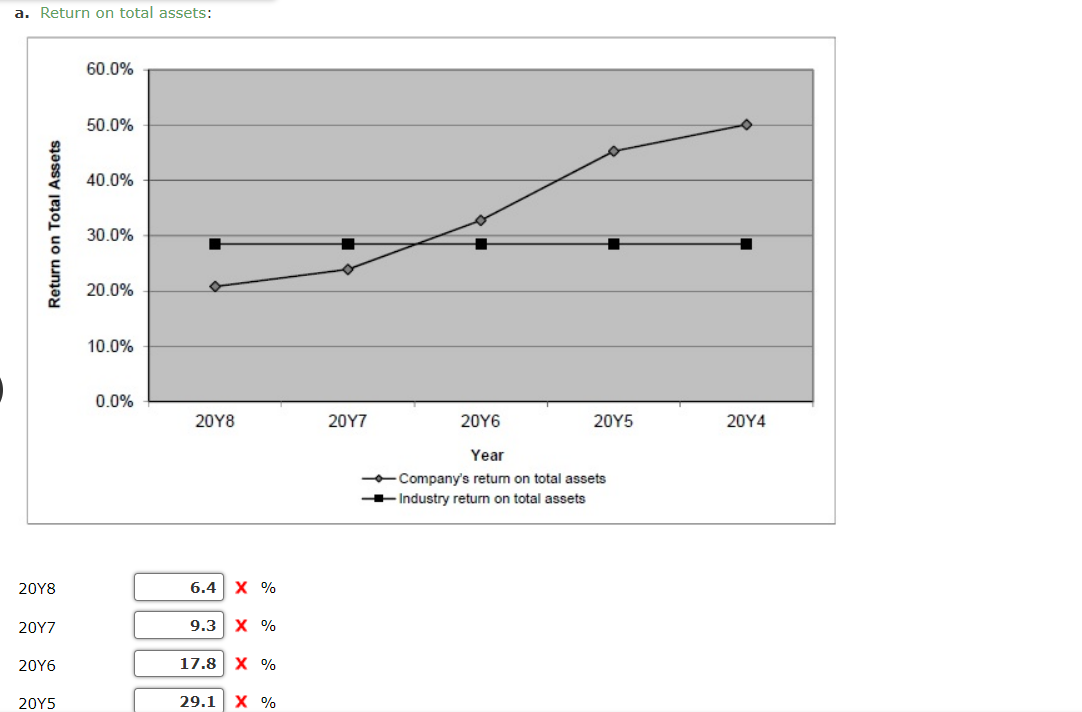
Transcribed Image Text:a. Return on total assets:
Return on Total Assets
20Y8
20Y7
20Y6
20Y5
60.0%
50.0%
40.0%
30.0%
20.0%
10.0%
0.0%
20Y8
6.4 X %
9.3 X %
17.8 X %
29.1 X %
20Y7
20Y6
20Y5
Year
-Company's return on total assets
Industry return on total assets
20Y4
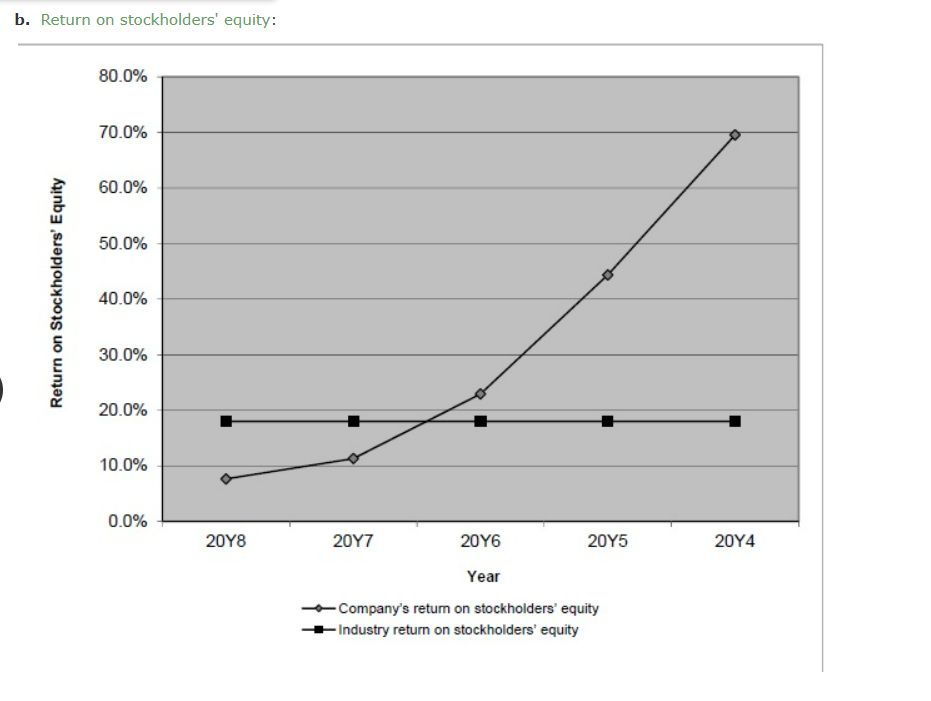
Transcribed Image Text:b. Return on stockholders' equity:
Return on Stockholders' Equity
80.0%
70.0%
60.0%
50.0%
40.0%
30.0%
20.0%
10.0%
0.0%
20Y8
20Y7
20Y6
Year
- Company's return on stockholders' equity
- Industry return on stockholders' equity
20Y5
20Y4
Expert Solution
This question has been solved!
Explore an expertly crafted, step-by-step solution for a thorough understanding of key concepts.

This is a popular solution!

Trending now
This is a popular solution!

Step by step
Solved in 3 steps with 10 images

Knowledge Booster


Learn more about
Need a deep-dive on the concept behind this application? Look no further. Learn more about this topic, accounting and related others by exploring similar questions and additional content below.Recommended textbooks for you
Survey of Accounting (Accounting I)
Accounting
ISBN:
9781305961883
Author:
Carl Warren
Publisher:
Cengage Learning

College Accounting, Chapters 1-27 (New in Account…
Accounting
ISBN:
9781305666160
Author:
James A. Heintz, Robert W. Parry
Publisher:
Cengage Learning
Survey of Accounting (Accounting I)
Accounting
ISBN:
9781305961883
Author:
Carl Warren
Publisher:
Cengage Learning
College Accounting, Chapters 1-27 (New in Account…
Accounting
ISBN:
9781305666160
Author:
James A. Heintz, Robert W. Parry
Publisher:
Cengage Learning