Return on total assets ratio: net income/ average total assets 21,331/(321,195+225,248)/2= 0.07807= 7.8% (2020 year) 11588/(162,648+225,248)/2= 0.059= 6.0% (2019 year) Write financial analysis report.


Q: Suppose these selected condensed data are taken from recent balance sheets of Tyson Farms (in…
A: Tyson Farm's Current ratio : Current ratio is defined as the current assets is divided by the…
Q: Required: Analyse Rara's financial statement. Include the following ratios for 2020 and discuss your…
A: Ratio Analysis The purpose of calculating the ratio analysis to analysis the financial statement to…
Q: 3. Complete the below table to calculate the balance sheet data in trend percents with 2019 as base…
A: Trend analysis is one of the technique of financial statements analysis under which each item in…
Q: Refer to the data below. $ 349,500 Retained earnings, December 31, 2019 Cost of buildings purchased…
A: Retained earnings balance as of December 31, 2020, = Retained earning December 31, 2019, + Net…
Q: Herbert Wong has extracted the following information from her income statement and balance sheet for…
A: The days in Accounts Receivable period indicates the days of credit sales. It can be calculated by…
Q: Selected balance sheet and income statement information from Illinois Tool Works follows. $…
A: Note: Since we only answer up to 3 sub-parts, we’ll answer the first 3. Please resubmit the question…
Q: Using the fiscal year end 2020 annual report for General Mills, Inc. and the figures from the 2020…
A: Ratio analysis is a quantitative method of gaining insight into a company's liquidity, operational…
Q: CALCULATE THE INTEREST COVERAGE RATIO. For the year ended December 31, Notes 2020 2019…
A: An Interest Coverage Ratio seems to be a profitability measure often used to evaluate a firm's…
Q: Using the fiscal year end 2020 annual report for General Mills, Inc. and the figures from the 2020…
A: Ratio Analysis - The ratio is the technique used by the prospective investor or an individual or…
Q: Required: Analyse Rara's financial statement. Include the following ratios for 2020 and discuss your…
A: Return on assets refers to the concept of profitability ratios which measures the ability of a…
Q: Extract of statement of Income and Expenditure for the Financial Years Ended 31 August 2020 2020…
A: Net asset value per unit share (NAV per unit share) Net asset value is total assets less total…
Q: Estimate the value of a share of common stock using the residual operating income (ROPI) model as of…
A: Information Provided: Discount rate (WACC) of 7.8% Humana 2018 2019 2020 2021 2022 Terminal…
Q: ABC Co. financial data for 2020 & 2019 are given below: Total Assets Total Liabilities Cash…
A: Ratio Analysis - Ratio Analysis is the technique used to compare two financial years or two…
Q: Income Statement: The income statement of Fairoz store Inc. is given for the years 2020 & 2019. 2020…
A: Comparison for 2019 and 2020 income statement to find out increase or decrease of net income for the…
Q: 3. Complete the below table to calculate the balance sheet data in trend percents with 2019 as base…
A: Lets understand the basics. Trend analysis is a analysis which shows how the variable are changed…
Q: Sunshine Marketing Comparative Statement of Financial Position For the years 2018 and 2019 2018 2019…
A: As per the Answer Sheet given, the Solution is provided in the same format: Statement of…
Q: Using the fiscal year end 2020 annual report for General Mills, Inc. and the figures from the 2020…
A: Ratio analysis is a quantitative method of gaining insight into a company's liquidity, operational…
Q: The current ratio is estimated as follows: Current ratio Particulars Amount (2019) Amount (2020)…
A: Following is the answer to the question.
Q: In 2020, Ted Baker had total assets of S510.31 million, of which $219.92 million were total…
A: Lets understand the basics. Current asset to total assets is a ratio in which current asset is…
Q: Ratio Analysis Consider the following information taken from GER's financial statements:…
A: Operating Cash Flow Ratio: The operating cash flow ratio is the relationship between operating cash…
Q: Compute and Interpret Ratios Selected balance sheet and income statement information from Illinois…
A: RNOA=Net operating profit after tax (NOPAT)Average Net operating profit after tax (NOA)×100ROA=Net…
Q: Selected Financial Ratios Sandhill Inc. Current Industry Average 2020 2019 Current ratio 1.62 1.63…
A: Following calculations shows the different types of ratios of Sandhill Inc. for the year 2021.…
Q: please calculate the following: 2017 2018 2019 2020 Quick ratio Debt…
A: Ratio Analysis - The ratio is the technique used by the prospective investor or an individual or…
Q: la & Scanned with CamScanner Balance Sheets as at 31 December 2018 E000 2019 L000 current assets at…
A: "Since you have posted a question with multiple sub-parts, we will solve first three sub-parts for…
Q: 1) Total Fixed Liabilities / LTD. 2) Current Liabilities / STD. 3) Total Liabilities.
A: As per our protocol we provide solution to the one question only or up-to first three sub-parts only…
Q: Ben Merchandise presented the following accounts for 2019 and 2018: P1,238,550.00 (current assets…
A: Non-current assets: These are the assets that are used in the business for more than a year. The…
Q: Selected balance sheet and income statement information from Illinois Tool Works follows. $…
A: RNOA=Net operating profit after tax Total Assets×100 RNOA (2019)=$9,224$15,671×100=58.9% RNOA…
Q: Compute and Interpret Ratios Selected balance sheet and income statement information from Illinois…
A: a. Return on Net Operating Assets (RNOA) = Net operating profit after taxAverage net operating…
Q: act of statement of Income and Expenditure for the Financial Years Ended 31 August 2020 2020…
A: The net asset value (NAV) is the market value per unit of all securities owned by a mutual fund…
Q: Condensed financial data of Nash Company for 2020 and 2019 are presented below. NASHCOMPANY…
A: There are two methods which we have used to prepare cash flow statements: A. Indirect method B.…
Q: CONSOUDATED BALANCE SHEETS Common-SIz Trend Analysis December 31, (In millions, except par value…
A: Current Ratio=Current AssetsCurrent LiabilitiesWorking Capital=Current Assets-Current…
Q: (S in thousands) 2020 2021 Income statement information $7,000 420 $ 6,000 160 Net sales Net income…
A: Ratio analysis is a tool that establishes a relationship between the different items. It is used to…
Q: Prepare a horizontal analysis of the following comparative income statement for the Buff Bodies…
A: Horizontal analysis is prepared to calculate the variance from previous year by showing…
Q: Randall Corporation reported the following revenue data:Year Net revenues (in…
A: Answer: Option c.
Q: Analyse Rara's financial statement. Include the following ratios for 2020 and discuss your findings…
A: a) Return on Assets is computed by dividing the net income by the average total assets b) Profit…
Q: COMPARITIVE INCOME STATEMENT for years ended 31 December 2019 2020 Revenues and gains *Sales revenue…
A: Functions in excel are of great importance as it minimizes the required efforts which are to be put…
Q: ndustry Financial Ratios (2019) Quick ratio 1.0 Current ratio 2.7 Inventory turnover 7.0 Total…
A: Ratio measurement is in terms of Financial world, depicts that a single accounting figure by itself…
Q: Consider the following information taken from GER's financial statements: September 30 (in…
A: FORMULA : 1 . QUICK RATIO = ( CURRENT ASSETS - INVENTORY ) / CURRENT LIABILITIES 2 . CASH RATIO = (…
Q: CALCULATE THE EBITDA For the year ended December 31, Notes 2020 2019 Revenue ₱…
A: Income statement is a statement which is prepared to reflect the financial performance of an…
Q: 2020 2019 Cash $42,300 $34,000 Accounts Receivable 70,600 59,600 Inventory 30,000…
A: A cash flow statement is a statement that shows all the inflows and outflows of the cash & cash…
Q: is the current ratio for 2020 and 2019
A:
Q: Total Assets for Wendy's Pumpkins on 1 January 2020 was $650,000 and on 31 December 2020 was…
A: The ratio analysis helps to analyse the financial statements of the business on the basis of various…
Q: calculate the current ratio for 2018 and 2019 respectively: 2018 current assets 101,600, current…
A: The current ratio indicates the liquidity available in the business. It shows the availability of…
Q: Condensed financial data of Novak Company for 2020 and 2019 are presented below. NOVAK COMPANY…
A: NOVAK COMPANY Cash Flow Statement (Indirect Method) For the year ended December 31, 2020 Cash…
Q: The following selected information (in thousands) is available for Carla Vista Inc.: 2021 2020 Total…
A: Solution:- Given, Information is available for Carla Vista Inc., Solvency ratios of Carla Vista…
Q: Net income for 2020 was P1,825,600. In 2021, it decreased by 53%. Still using the 2020 net income as…
A: Introduction:- Net income denotes the amount of a profit a company after deduction of all expenses.…
Q: Compute and Interpret Ratios Selected balance sheet and income statement information from Illinois…
A: Adjusted equity = Unadjusted equity + Treasury stock Adjusted total assets = Unadjusted assets…
Q: FILLING IN THE RATIOS .. THE LEFT SIDE IS 2019 THE RIGHT SIDE IS 2020 IN THE IMAGE. Jergan…
A: (4) Earnings Per Share = Net Income/Average Outstanding Shares 2019 = 57,560/((30400+31600)/2) =…
Q: All-Hands Property & Casualty Insurance Company has the following financial ratios. 2019 2018 Loss…
A: Combined Ratio:- It is a ratio calculated with the combination of Loss Ratio and Expenses Ratio.…
Q: Income Statement: The income statement of Taco Bell company is given for the years 2020 & 2019. 2020…
A: Operating profit margin = (Net sales - COGS) / Net sales
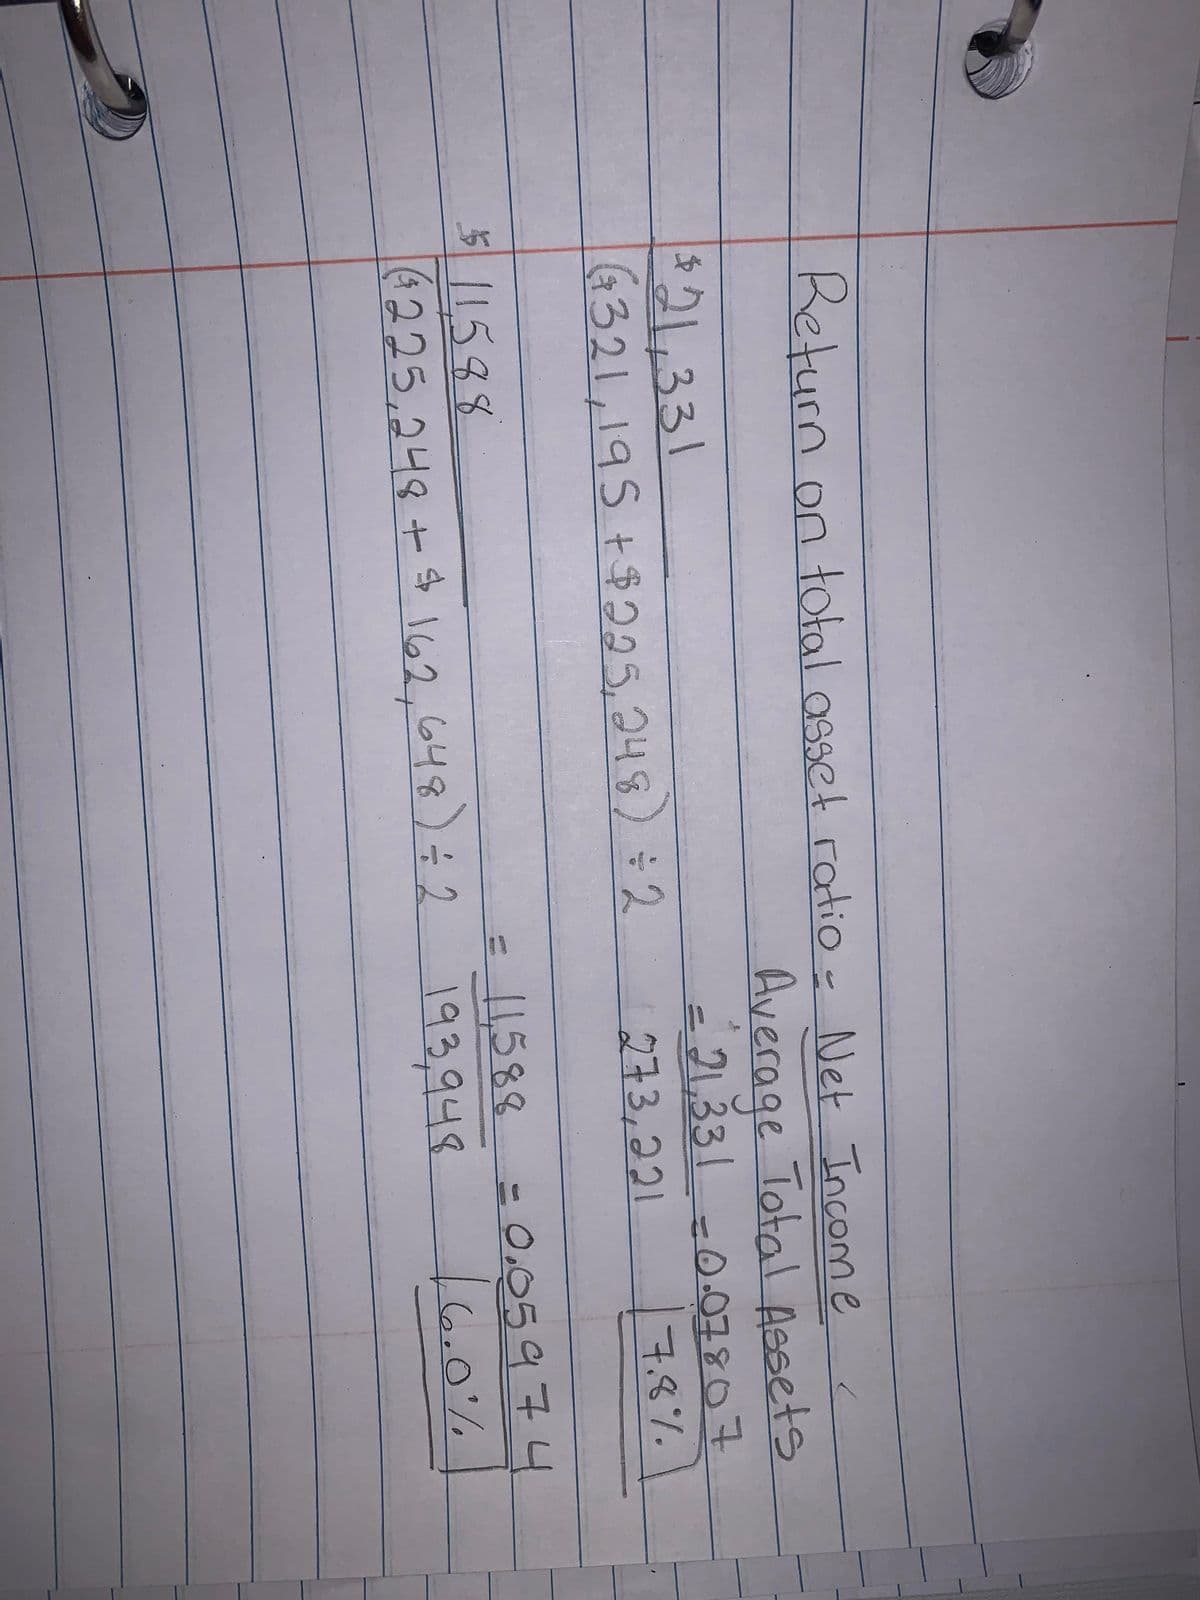
Return on total assets ratio: net income/ average total assets
21,331/(321,195+225,248)/2= 0.07807= 7.8% (2020 year)
11588/(162,648+225,248)/2= 0.059= 6.0% (2019 year)
Write financial analysis report.


Trending now
This is a popular solution!

Step by step
Solved in 3 steps


- Twenty metrics of liquidity, solvency, and profitability The comparative financial statements of Automotive Solutions Inc. are as follows. The market price of Automotive Solutions Inc. common stock was $119.70 on December 31, 20Y8 Instructions Ratio of fixed assets to long-term liabilitiesTwenty metrics of liquidity, solvency, and profitability The comparative financial statements of Automotive Solutions Inc. are as follows. The market price of Automotive Solutions Inc. common stock was $119.70 on December 31, 20Y8 Instructions Asset turnoverGIVE AN INTERPRETATION OF THESE RATIOS CONCLUSIVELY Acid test ratio = (total current asset – inventory – prepaid expenses) / total current liability Total asset turnover = 1.918 times Gearing ratio = 0.2243 or 22.43% Gross profit margin = 0.361 or 36.1% Net profit margin = 0.1143 or 11.43% Return on capital employed = 0.2664 or 26.64% Current ratio = 2.1753 times Acid test ratio = 1.0413 times Receivables days = (Trade Receivables/Net Sales) * 365 = (74480/768400) *365 = 36 days Payables days = (Trade Payables/ Net Purchases) * 365 = (72000/460400) *365 = 58 days Inventory Days = (Inventory/ Cost of goods sold) * 365 = (84000/476400) * 365 = 65 days Gross Profit Margin (GPM) = 292000/808800*100= 36.10% Net Profit Margin (NPM) = 92480/808800 *100 = 11.43% Return on Capital Employed (ROCE) = 92480/327080*100 = 28.27% Current ratio = 162280/74600= 2.17 Acid test ratio = (162280- 84000)/74600= 1.049 Total asset turnover = Sales revenue / Total average asset…
- The comparative balance sheet of Merrick Equipment Co. for Dec. 31, 20Y9 and 20Y8, is:Dec. 31, 20Y9 Dec. 31, 20Y8AssetsCash $70,720 $47,940Accounts receivable (net) 207,230 188,190Inventories 298,520 289,850Investments 0 102,000Land 295,800 0Equipment 438,600 358,020Accumulated depreciation—equipment (99,110) (84,320)Total assets $1,211,760 $901,680Liabilities and Stockholders' EquityAccounts payable (merchandise creditors) $205,700 $194,140Accrued expenses payable (operating expenses) 30,600 26,860Dividends payable 25,500 20,400Common stock, $1 par 202,000 102,000Paid-in capital: Excess of issue price over par—common stock 354,000 204,000Retained earnings 393,960 354,280Total liabilities and stockholders' equity $1,211,760 $901,680The income statement for the year ended December 31, 20Y9, is as follows:Sales $2,023,898Cost of goods sold 1,245,476Gross profit $778,422Operating expenses:Depreciation expense $14,790Other operating expenses 517,299Total operating expenses 532,089Operating…Income 31955 , assets 213000, assets at end year, 259000. What return on assetsSelected comparative statement data for Oriole Company are presented below. All balance sheet data are as of December 31. 20222021Net sales$1,165,000 $1,125,000Cost of goods sold705,000 645,000Interest expense20,000 15,000Net income154,945 145,000Accounts receivable145,000 125,000Inventory105,000 100,000Total assets785,000 700,000Preferred stock (6%)205,000 200,000Total stockholders’ equity635,000 525,000 Compute the following ratios for 2022. (Round answers to 1 decimal place, e.g. 1.8 or 2.5%) (a)Profit marginenter the profit margin in percentages %(b)Asset turnoverenter the asset turnover in times times(c)Return on assetsenter the return on assets in percentages %(d)Return on common stockholders’ equityenter the return on common stockholders' equity in percentages %
- Selected ratios formulars Unilever 2021 BOPP 2021 ROCE PBIT / net assets * 100 (32,424/39,406 *100 = - 82% 102,154 / 192,758 *100 =53% Net Assets Turnover Revenue / Net Assets 526,912 / 39,406 = 13 times 214,174 / 192,758 = 1 time Gross Profit Margin Gross profit / revenue *100 97,046 / 526,912 *100 18.4% 115,462 / 214,174 * 100 54% Net Profit Before Tax PBT / revenue * 100 (35,005) / 526,912* 100 = -6.6% 104,778 / 214,174* 100 =48.9% Current Ratio Current assets / current liabilities 214,665/341,171 = 0.5 139,104 / 30,368 = 4.5 Quick Ratio Current assets – inventory / current liabilities 214,665-91,627 /341,171 = 0.4 139,104 -13,248/ 30,368 = 4.1 Inventory Days Inventory / cost of sales * 365 days 91,627/ 429,866 *365 = 77 days 13,248 / 101,397 *365 = 47 days Receivable Days Receivables / cost of sales * 365 days 24,515 / 429,866 *365 =20 days 92,860 / 101,397 *365 =334 days Payable Days…Use the below information to answer the following questions: 20202021Sales$11,573$12,936Depreciation 1661 1736Cost of goods sold 3979 4707Other Expenses 846 924Interest Expense 776 926Cash 6067 6466Accounts Receivables 8034 9427Short-term Notes Payable 1171 1147Long-term debt 20,320 24,696Net fixed assets 50,888 54,273Accounts Payable 4384 4644Tax rate 26% 34%Inventory 14,283 15,288Payout ratio 33% 30% A. Create the Balance Sheets for 2020 & 2021.Use the below information to answer the following questions: 20202021Sales$11,573$12,936Depreciation 1661 1736Cost of goods sold 3979 4707Other Expenses 846 924Interest Expense 776 926Cash 6067 6466Accounts Receivables 8034 9427Short-term Notes Payable 1171 1147Long-term debt 20,320 24,696Net fixed assets 50,888 54,273Accounts Payable 4384 4644Tax rate 26% 34%Inventory 14,283 15,288Payout ratio 33% 30% A. Create the Income Statements for 2020 and 2021 (including dividends paid and retained earnings).
- If given the following information: Current Assets - 2073Current Liabilities - 1634Cash - 1182Inventory - 316Net working capital - 934Total Assets - 3873Average Daily Operating Costs - 344 Find the Current Ratio.44- Calculate net profit from the following? Net sales OMR 100000, Cost of goods sold OMR 40000, Rent received OMR 20000, Salaries OMR 10000, Insurance OMR 6000 and Depreciation OMR 8000. a. OMR 64000 b. OMR 70000 c. OMR 56000 d. OMR 60000A2 aii Use the following information for Delta Corporation: Year 20X1 20X2 Net sales $1,500,000 $1,656,598 Cost of goods sold 675,000 745,469 Depreciation 270,000 298,188 Interest paid 43,600 44,000 Cash 127,500 140,811 Account’s receivable 450,000 496,980 Inventory 525,000 579,809 Net fixed assets 1,800,000 1,987,918 Accounts payable 375,000 414,150 Notes payable 45,000 50,000 Long-term debt 500,000 500,000 Common stock 1,000,000 1,000,000 Retained earnings 982,500 1,241,368 Tax rate 35% 35% Dividend payout 30% 30% Delta has 600,000 common shares outstanding. The firm is projecting a 20% increase in net sales for the coming year (20X3). Delta uses the percentage of sales approach to plan for its financing needs. In using this approach, the firm assumes that cost of goods sold, all assets (current and fixed), and accounts payable will all remain a constant…