Additional Algo 15-12 Forecasting with Seasonality Demand history for the past three years is shown below, along with the seasonal indices for each quarter. Seasonal Index 1.25 Year Year 11 Year 2 Year 3 Quarter 01 02 03 04 01 02 03 04 01 02 03 04 Demand 926 819 585 515 912 874 651 552 861 828 571 542 1.176 0.837 0.745 1.25 1.176 0.837 0.745 1.25 1.176 0.837 0.745 Use exponential smoothing with alpha (a) - 0.3 and an initial forecast of 720 along with seasonality to calculate the Year 4, Q1 forecast. Note: Do not round intermediate calculations. Round your answer to the nearest whole number.
Additional Algo 15-12 Forecasting with Seasonality Demand history for the past three years is shown below, along with the seasonal indices for each quarter. Seasonal Index 1.25 Year Year 11 Year 2 Year 3 Quarter 01 02 03 04 01 02 03 04 01 02 03 04 Demand 926 819 585 515 912 874 651 552 861 828 571 542 1.176 0.837 0.745 1.25 1.176 0.837 0.745 1.25 1.176 0.837 0.745 Use exponential smoothing with alpha (a) - 0.3 and an initial forecast of 720 along with seasonality to calculate the Year 4, Q1 forecast. Note: Do not round intermediate calculations. Round your answer to the nearest whole number.

Practical Management Science
6th Edition
ISBN:9781337406659
Author:WINSTON, Wayne L.
Publisher:WINSTON, Wayne L.
Chapter13: Regression And Forecasting Models
Section13.7: Exponential Smoothing Models
Problem 26P: The file P13_26.xlsx contains the monthly number of airline tickets sold by the CareFree Travel...

Related questions
Question
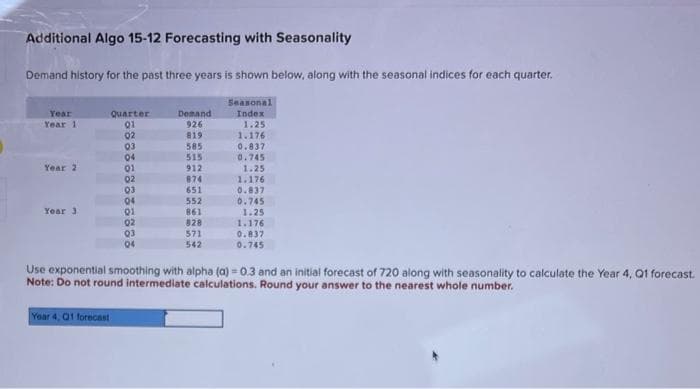
Transcribed Image Text:Additional Algo 15-12 Forecasting with Seasonality
Demand history for the past three years is shown below, along with the seasonal indices for each quarter.
Seasonal
Index
1.25
Year
Year 1
Year 2
Year 3
Quarter
01
02
03
04
01
02
03
04
01
02
03
04
Year 4, 01 forecast
Demand
926
819
585
515
912
874
651
552
861
828
571
542
1.176
0.837
0.745
1.25
1.176
0.837
0.745
1.25
1.176
0.837
0.745
Use exponential smoothing with alpha (a) - 0.3 and an initial forecast of 720 along with seasonality to calculate the Year 4, Q1 forecast.
Note: Do not round intermediate calculations. Round your answer to the nearest whole number.
Expert Solution
This question has been solved!
Explore an expertly crafted, step-by-step solution for a thorough understanding of key concepts.

This is a popular solution!

Trending now
This is a popular solution!

Step by step
Solved in 2 steps with 5 images

Recommended textbooks for you
Practical Management Science
Operations Management
ISBN:
9781337406659
Author:
WINSTON, Wayne L.
Publisher:
Cengage,

Contemporary Marketing
Marketing
ISBN:
9780357033777
Author:
Louis E. Boone, David L. Kurtz
Publisher:
Cengage Learning

Marketing
Marketing
ISBN:
9780357033791
Author:
Pride, William M
Publisher:
South Western Educational Publishing
Practical Management Science
Operations Management
ISBN:
9781337406659
Author:
WINSTON, Wayne L.
Publisher:
Cengage,
Contemporary Marketing
Marketing
ISBN:
9780357033777
Author:
Louis E. Boone, David L. Kurtz
Publisher:
Cengage Learning
Marketing
Marketing
ISBN:
9780357033791
Author:
Pride, William M
Publisher:
South Western Educational Publishing