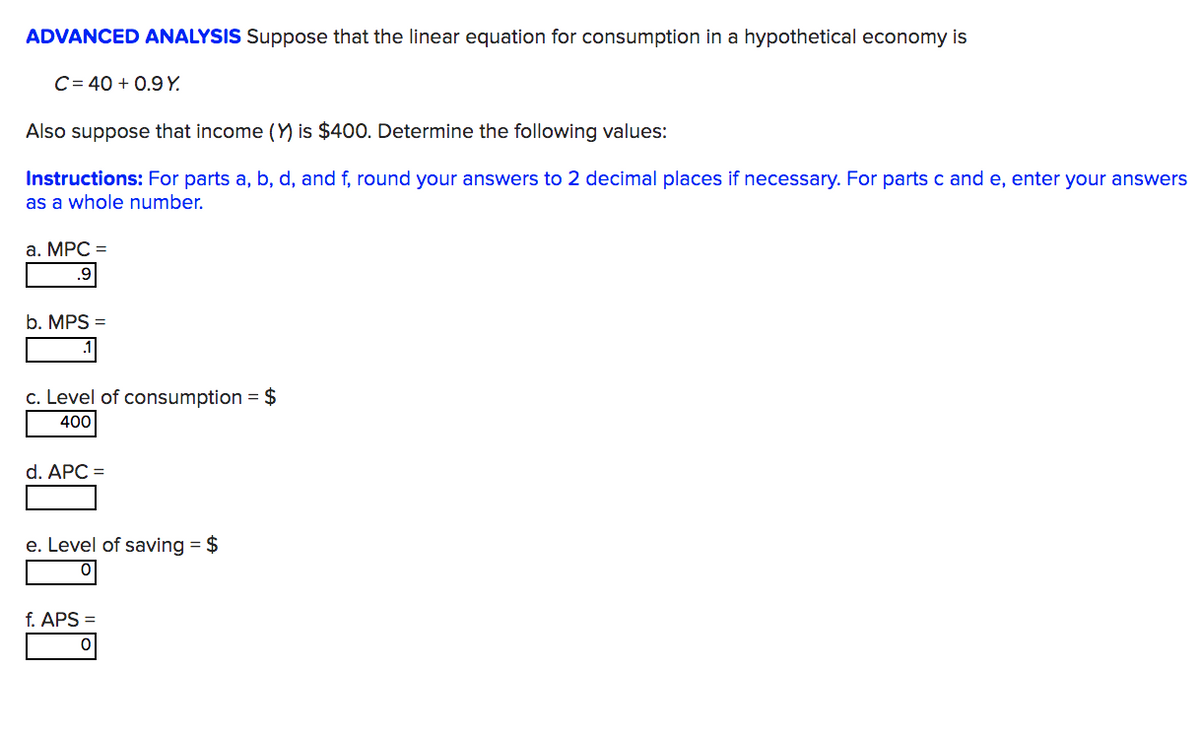
ADVANCED ANALYSIS Suppose that the linear equation for consumption in a hypothetical economy is C=40+ 0.9 Y. Also suppose that income (Y) is $400. Determine the following values: Instructions: For parts a, b, d, and f, round your answers to 2 decimal places if necessary. For parts c and e, enter your answers as a whole number. a. MPC = .9 b. MPS = .1 c. Level of consumption = $ 400 d. APC = e. Level of saving = $ f. APS 이 0


Q: please answer in text form and in proper format answer with must explanation , calculation for each…
A: The shift in AD will be caused as follows: Increase in Disposable Income: A tax cut increases the…
Q: Suppose the utility function of a representative consumer in Europe is !(#, %) = 6)*+# + )*+%, where…
A: Given the utility function U(F,G)=6F+G, where F is non-GM food, and G is GM food, we can derive…
Q: Consider the following data regarding students' college GPAs and high school GPAs. The estimated…
A: Step 1: Compute the estimated college GPA for each level of high school GPA using the regression…
Q: am. 125.
A: Step 1: Formulate the equations1.1. Recognize that equilibrium occurs when total output equals total…
Q: None
A: To solve for the price elasticity of demand, we will use the midpoint formula:Price Elasticity of…
Q: 86°F Haze For each of the regions listed in the following table, use the midpoint meth d to identify…
A: Regarding the true/false statement:False. The slope of the demand curve is not necessarily equal to…
Q: Day care is provided by a competitive constant-cost industry at a price of $40 per child per day.…
A: Let's simplify the explanation with examples: (i) In the short run: Price of day care: Imagine…
Q: Listen Number of People Category (Millions) Total Population 300 Working-Age Population 210 Labor…
A: The unemployment rate is a measure of the proportion of the civilian labor force that is unemployed…
Q: Which of the following is an advantage of divine command theory? A.) Divine command theory focuses…
A: Approach to solving the question: This choice, which stresses the objective foundation of morality…
Q: 2. Suppose that a presidential candidate who promised large personal income tax cuts is elected. Use…
A: If people anticipate a large tax cut in the future, they may adjust their behavior in the present,…
Q: Chapter 06 Homework For each of the prices listed in the following table, determine the quantity of…
A: Question 1:In the table provided, the price of blueberries is $35 per box. At this price, the…
Q: please answer in text form and in proper format answer with must explanation , calculation for each…
A: The price elasticity of demand (PED) for craft beer tells us how responsive consumers are to a…
Q: - The following table shows Farmer Parker's revenue, cost, and profit from wheat farming:…
A: Concept: Fixed cost of production is that part or component of the total cost that does not move…
Q: QUESTION 9 Price Level AS P1 P2 AD AD' Y2 Yi Real National Income The graph above refers to a…
A: Given the scenario described in graph a decrease in consumer confidence leads to a leftward shift of…
Q: Suppose the utility function of a representative consumer in Europe is !(#, %) = 6)*+# + )*+%, where…
A: To be as satisfied as possible, a European customer wants to purchase the optimal mix of genetically…
Q: Cecil's Manufacturing is considering producing a new product. The sales price would be $9.75 per…
A: Let X be the number of units sold.Sales price= 9.75XFixed cost= 116,000Let y=year =7Operating cost=…
Q: Solve all questions compulsory......
A: Part bThe correct answer is Firm D.Firm D has the highest price elasticity of demand, which means…
Q: P ECON 222 Standardized Artifact The Individual Firm MC Q D = MR In the adjacent graph, illustrate…
A: a. Set Q* at 500On your graph, the equilibrium quantity is the intersection of D = MR and MC b. Set…
Q: 36 OF 41 QUESTIONS REMAINING 1 Point The payoff matrix below shows the possible actions and payoffs…
A: Let's look at the choices of Walmart and Target Walmart's choices (highlighted with blue boxes)If…
Q: A monopolist faces a market demand curve given by Q = 70 – P. The Monopolist’s marginal revenue…
A: Let's break down the solution with examples and explain each step: a. i. To maximize profits, the…
Q: please help me with this question
A: a. To determine absolute advantage, we compare the labor requirements between the two countries.…
Q: According to the two graphs, a decrease in the aggregate price level would cause a shift from: a. A…
A: When aggregate price level goes down, consumers are more likely to spend on products due to the…
Q: consider the following development which happened at the same time: households reduced their…
A: $1 million less in cash held by households in favor of bank deposits:A $1 million reduction in…
Q: Hand written solutions are strictly prohibited
A: The correct answer is: (d) Services and IndustryIn North Africa, the largest contributions to the…
Q: Back ECON2001 Graded Final Assessment (40%) Time left 0:46:19 Question 6 Answer saved Marked out of…
A:
Q: Back to Assignment Attempts 1 1 Keep the Highest 1/4 11. Costs in the short run versus in the long…
A: Economies of scale arise when a large number of outputs can be produced with decreasing average…
Q: based on the information in the table what is marla's profit margin? marla's smoothie shop total…
A: To calculate Marla's profit margin, we first need to find her profit, which is the difference…
Q: Consider the below graph of a firm in a monopolistically competitive market for athletic wear. The…
A: Detailed explanation:A monopolistically competitive firm behaves like a monopoly in the short run.…
Q: After a financial crisis hits the country of Barbaria, 1 million people become unemployed. If 65…
A: We'll apply the formula you gave us to determine the unemployment rate:The formula for the…
Q: Typed please and give correct answer explanation as well as non correct options explanation I will…
A: A sudden price decrease: When an asset experiences a sudden price decrease, it typically reflects a…
Q: Give exact answer to every part step by step and take a like
A: AR (Average Revenue): This line starts high and slopes downward, representing how the average…
Q: Better Biscuits is planning to make and sell a new cookie and expects the following cash flows at…
A: Step 1: The calculation of the NPV AB1YearCashflow (million)20 $ (90.00)31 $…
Q: Assume the economy is operating in a horizontal range of the aggregate supply curve. This fall in…
A: In the scenario where the economy is operating in a horizontal range of the aggregate supply curve,…
Q: flows given in the table below. What is the IRR of the project? (Use percent format and give two…
A: Compute IRR:Formulas:
Q: The advantages of a transnational strategy include everything except Multiple Choice lower costs…
A: A transnational strategy aims to strike a balance between local adaptation and global…
Q: None
A: Approach to solving the question: Detailed explanation:Kindly reach out if you have any questions.…
Q: Consider the following Ricardian example with many goods, using standard Ricardian assumptions.…
A: Approach to solving the question: To solve this question -Identify Absolute Advantage : Compare the…
Q: please answer in text form and in proper format answer with must explanation , calculation for each…
A: When evaluating the investment in manufacturing equipment at Vernon Electronics, two depreciation…
Q: the socially optimal price? place the line segment labled pollution limit In accordance with the…
A: The given graph represents the graph of negative externality. Here the marginal private cost is more…
Q: None
A: When aggregate demand experiences a decline, a multitude of factors come into play, shaping the…
Q: When the price of a good rises, what happens to the quantity demanded, all else being equal? A) It…
A: The law of demand states that when the price of a good increases, there is typically a corresponding…
Q: 22. Consider Fig. 5, which shows the market demand as well as a monopolist's costs. The total fixed…
A: The monopolist will maximize profit where marginal revenue (MR) equals marginal costs (MC). Form the…
Q: Q1. Consider a consumer with a lifetime utility function U(c, c') = u(c) + Bu(c) that satisfies all…
A: REFERENCEWillman, A. (2003). Consumption, habit persistence, imperfect information and the lifetime…
Q: T/F: The U.S. CIA covertly organized coups (i.e. - the overthrow of a government) in Guatemala and…
A: Approach to solving the question: Detailed explanation: The U.S. secretly helped take down the…
Q: 12. *The following chart provides information on a firm that hires labor competitively and sells its…
A: Units of LaborTotal OutputProduct PriceMarginal ProductTotal…
Q: The Phillips Curve and Inflation - End of Chapter Problem Recently, policy makers have debated…
A: a. This will cause an immediate shift to the left in the short-run Phillips curve. The Phillips…
Q: Imagine that the production function for tuna cans is given by: q = 6K + 4L Where q = output of tuna…
A: a. It is given that the production function is q=6K+4L. If the capital (K) is 6, then number of…
Q: Am. 116.
A: The B/C (Benefit-Cost) analysis is a method used to evaluate the financial efficiency of a project…
Q: Bradford is a small town that currently has no fast-food restaurants. McDonald's and Burger King are…
A: Scenarios for Burger KingIf McDonald's Builds a Large Store:Enter the Market: Burger King earns a…
Q: please answer in text form and in proper format answer with must explanation , calculation for each…
A: a). As per the given data Exchange Table is as follows: Distribution Of output From Purchase…

Step by step
Solved in 2 steps with 1 images

- ADVANCED ANALYSIS Suppose that the linear equation for consumption in a hypothetical economy is C = 60 + 0.75Y. Also suppose that income (Y) is $600. Determine the following values: Instructions: For parts a, b, d, and f, round your answers to 2 decimal places if necessary. For parts c and e, enter your answers as a whole number. a. MPC = b. MPS = c. Level of consumption = $ d. APC = e. Level of saving = $ f. APS =Macroeconomics Question No.2 Suppose the consumption function is given by C = 100 + 0.8YD and that I = 50, while G=200, TR=62.5 and t=0.25. What is the equilibrium level of income? What is the level of saving in equilibrium? If investment were to rise to 150, what would be the effect be on equilibrium income. What is the value of multiplier in part a. and c. Draw a diagram indicating the equilibrium in part a. and c.ADVANCED ANALYSIS Assume that the consumption schedule for a private closed economy is such that consumption is: C = 100 + 0.75Y Assume further that planned investment Ig is independent of the level of real GDP and constant at Ig = 50. Recall also that, in equilibrium, the real output produced (Y) is equal to aggregate expenditures: Y = C + Ig Instructions: Enter your answers as whole numbers.a. Calculate the equilibrium level of income or real GDP for this economy. Equilibrium GDP (Y) = $ . b. What happens to equilibrium GDP if Ig changes to 60? Equilibrium GDP (Y) = $ . What does this outcome reveal about the size of the spending multiplier? Spending multiplier = .
- 1. Suppose that a rise in income from P60,000 to P70,000 leads to an increase in consumption from P47,000 to P54,000.For an economy the following functions have been given:C = 100 + 0.8YS = -100 + 0.2YI = 120 – 5rMs = 120Md = 0.2Y – 5rCalculate the following:5.1.1. IS equation 5.1.2. LM equation 5.1.3. Equilibrium level of income 5.1.4. Equilibrium level of interest rate. 5.1.5 Calculate National saving. 5.1.6 Calculate money demand 5.1.7 Find consumption2. Suppose that consumption equals $500 billion when the disposable income is $0 and that each increase of $100 billion in disposable income causes consumption to increase by $70 billion. a. Draw a graph of the consumption function using this information. The axes must be labeled correctly, and the consumption function should have at least two points on the graph (correct coordinates). b. What is the Marginal Propensity to Consume in this economy? How did you arrive at your answer? Please show your work. Note:- Do not provide handwritten solution. Maintain accuracy and quality in your answer. Take care of plagiarism. Answer completely. You will get up vote for sure.
- 23) Refer to Figure 1.5. As income decreases, consumption decreases by a decreasing amount. If consumption is graphed on the vertical axis and income is graphed on the horizontal axis, the relationship between consumption and income would look like which of the following Panels? A) A B) B C) C D) D Note:- Do not provide handwritten solution. Maintain accuracy and quality in your answer. Take care of plagiarism. Answer completely. You will get up vote for sure.Advanced analysis) Assume the following consumption schedule: C = 20 + 0.9Y, where C is consumption and Y is disposable income. At a(n) $1,200 level of disposable income, the level of saving is9. If the MPC is greater than zero but less than one, then we can be sure that when disposable income rises by P1 consumption will: a. not be affected b. will rise by more than P1 c. will rise by less than P1 d. will rise by exactly P1.
- Suppose that the real interest rate is 6%. Next, assume that some factors changes, such that the expected rate of return, declines by  two percentage points at each prospective level of investment. Assuming no change in the real interest rate, by how much and in what direction will the investment change?  which of the following might cause this change: (a) a decision to increase inventories; (b) an increase in excess production capacity.7 Consider a model in which an individual lives only two periods. This person has diminishing marginal utility of consumption and receives an income of $20,000 in period 1 and an income of $5,000 in period 2. The private interest rate is 10 percent per period, and this person can borrow or lend money at this rate. Also assume that this person intends to consume all of his income over his lifetime. a. Give a hypothetical numerical example of what a person’s optimal consumption would be over these two periods. In answering this question, what assumptions did you make?Linear equations for the consumption and saving schedules take the general form C = a + bY and S = -a + (1 - b)Y, where C, S, and Y are consumption, saving, and national income, respectively. The constant a represents the vertical intercept, and b represents the slope of the consumption schedule.a. Use the following data to substitute numerical values for a and b in the consumption and saving equations. b. What is the economic meaning of b? Of (1 - b)? c. Suppose that the amount of saving that occurs at each level of national income falls by $20 but that the values of b and (1 - b) remain unchanged. Restate the saving and consumption equations for the new numerical values, and cite a factor that might have caused the change.