After the premiere of the new comedy Bumblebee, moviegoers were asked in a quick poll whether they liked the movie. Out of 25 adults, all but 5 said they liked the movie, whereas out of 50 teenagers, all but 16 said they liked the movie. Fill in the blanks below to make the most reasonable statement possible. At the movie premiere, (Choose one) v moviegoers liked the movie less. That is because % disliked the movie, whereas only % of the (Choose one) ▼ moviegoers disliked the movie. adult teenage
After the premiere of the new comedy Bumblebee, moviegoers were asked in a quick poll whether they liked the movie. Out of 25 adults, all but 5 said they liked the movie, whereas out of 50 teenagers, all but 16 said they liked the movie. Fill in the blanks below to make the most reasonable statement possible. At the movie premiere, (Choose one) v moviegoers liked the movie less. That is because % disliked the movie, whereas only % of the (Choose one) ▼ moviegoers disliked the movie. adult teenage

Big Ideas Math A Bridge To Success Algebra 1: Student Edition 2015
1st Edition
ISBN:9781680331141
Author:HOUGHTON MIFFLIN HARCOURT
Publisher:HOUGHTON MIFFLIN HARCOURT
Chapter11: Data Analysis And Displays
Section: Chapter Questions
Problem 1CA

Related questions
Question
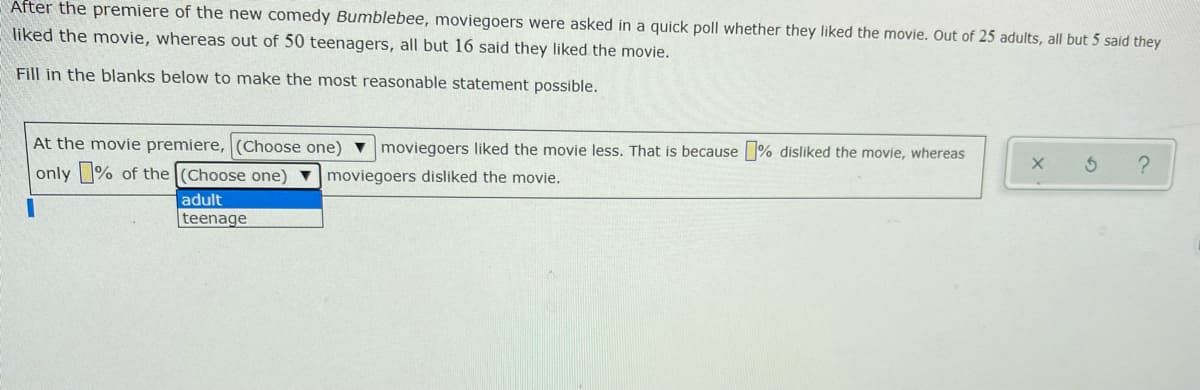
Transcribed Image Text:After the premiere of the new comedy Bumblebee, moviegoers were asked in a quick poll whether they liked the movie. Out of 25 adults, all but 5 said they
liked the movie, whereas out of 50 teenagers, all but 16 said they liked the movie.
Fill in the blanks below to make the most reasonable statement possible.
At the movie premiere, (Choose one)
moviegoers liked the movie less. That is because % disliked the movie, whereas
only % of the (Choose one) vmoviegoers disliked the movie.
adult
teenage
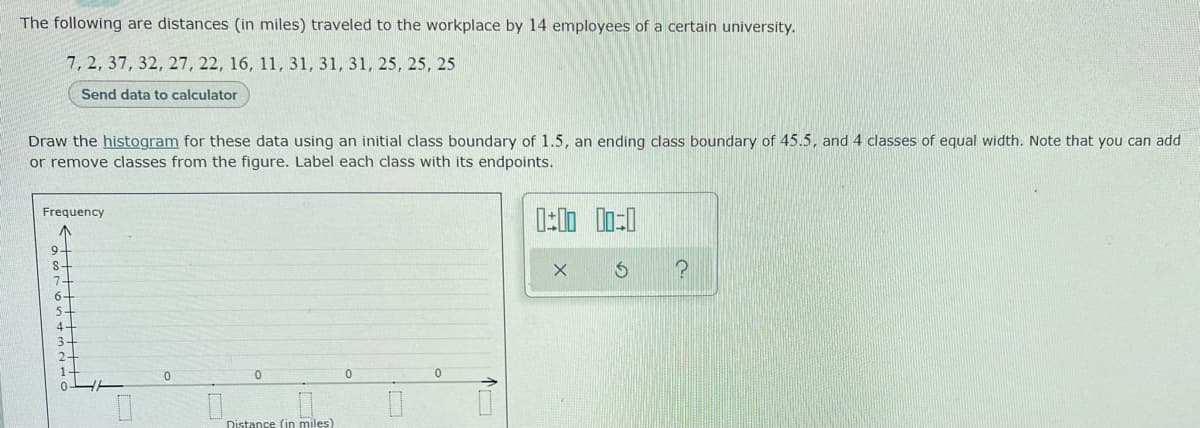
Transcribed Image Text:The following are distances (in miles) traveled to the workplace by 14 employees of a certain university.
7, 2, 37, 32, 27, 22, 16, 11, 31, 31, 31, 25, 25, 25
Send data to calculator
Draw the histogram for these data using an initial class boundary of 1.5, an ending class boundary of 45.5, and 4 classes of equal width. Note that you can add
or remove classes from the figure. Label each class with its endpoints.
Frequency
9-
S-
7-
4.
3+
Distance (in miles)
Expert Solution
This question has been solved!
Explore an expertly crafted, step-by-step solution for a thorough understanding of key concepts.

This is a popular solution!

Trending now
This is a popular solution!

Step by step
Solved in 2 steps with 1 images

Recommended textbooks for you
Big Ideas Math A Bridge To Success Algebra 1: Stu…
Algebra
ISBN:
9781680331141
Author:
HOUGHTON MIFFLIN HARCOURT
Publisher:
Houghton Mifflin Harcourt

Holt Mcdougal Larson Pre-algebra: Student Edition…
Algebra
ISBN:
9780547587776
Author:
HOLT MCDOUGAL
Publisher:
HOLT MCDOUGAL

Glencoe Algebra 1, Student Edition, 9780079039897…
Algebra
ISBN:
9780079039897
Author:
Carter
Publisher:
McGraw Hill
Big Ideas Math A Bridge To Success Algebra 1: Stu…
Algebra
ISBN:
9781680331141
Author:
HOUGHTON MIFFLIN HARCOURT
Publisher:
Houghton Mifflin Harcourt
Holt Mcdougal Larson Pre-algebra: Student Edition…
Algebra
ISBN:
9780547587776
Author:
HOLT MCDOUGAL
Publisher:
HOLT MCDOUGAL
Glencoe Algebra 1, Student Edition, 9780079039897…
Algebra
ISBN:
9780079039897
Author:
Carter
Publisher:
McGraw Hill