Age at diagnosis for each of 20 patients under treatment for meningitis was given in a research paper. Suppose the ages (in years) were as follows. 22 20 64 18 21 18 18 18 25 19 18 20 18 19 28 16 18 18 (a) Calculate the values of the sample mean and the standard deviation. (Round your standard deviation to four decimal places.) sample mean standard deviation mild outliers 20 18 yr yr (b) Compute the upper quartile, the lower quartile, and the interquartile range. upper quartile yr lower quartile yr interquartile range. yr (c) Are there any mild or extreme outliers present in this data set? (Enter your answers as comma-separated lists. If there is no answer, enter NONE.) extreme outliers
Age at diagnosis for each of 20 patients under treatment for meningitis was given in a research paper. Suppose the ages (in years) were as follows. 22 20 64 18 21 18 18 18 25 19 18 20 18 19 28 16 18 18 (a) Calculate the values of the sample mean and the standard deviation. (Round your standard deviation to four decimal places.) sample mean standard deviation mild outliers 20 18 yr yr (b) Compute the upper quartile, the lower quartile, and the interquartile range. upper quartile yr lower quartile yr interquartile range. yr (c) Are there any mild or extreme outliers present in this data set? (Enter your answers as comma-separated lists. If there is no answer, enter NONE.) extreme outliers

Glencoe Algebra 1, Student Edition, 9780079039897, 0079039898, 2018
18th Edition
ISBN:9780079039897
Author:Carter
Publisher:Carter
Chapter10: Statistics
Section10.3: Measures Of Spread
Problem 26PFA

Related questions
Question
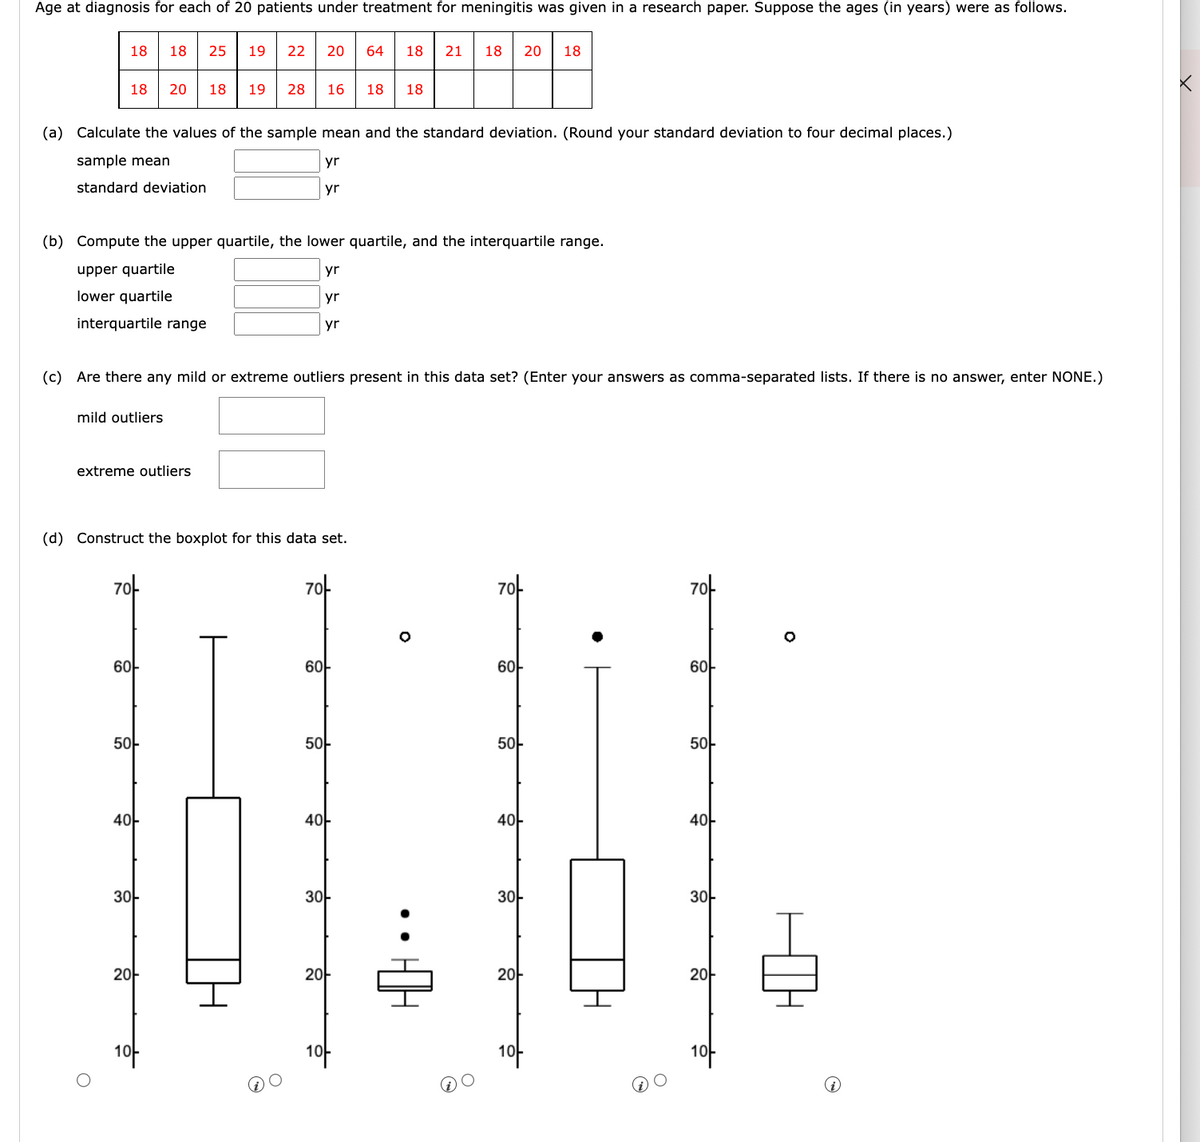
Transcribed Image Text:Age at diagnosis for each of 20 patients under treatment for meningitis was given in a research paper. Suppose the ages (in years) were as follows.
18
18 20 18 19 28
(a) Calculate the values of the sample mean and the standard deviation. (Round your standard deviation to four decimal places.)
sample mean
yr
yr
standard deviation
(b) Compute the upper quartile, the lower quartile, and the interquartile range.
upper quartile
yr
lower quartile
yr
interquartile range
yr
mild outliers
(c) Are there any mild or extreme outliers present in this data set? (Enter your answers as comma-separated lists. If there is no answer, enter NONE.)
extreme outliers
70
18 25 19 22 20 64 18 21 18 20 18
(d) Construct the boxplot for this data set.
60-
50
40-
30-
20
16 18 18
1아
70-
60-
50
40-
30-
20
10-
70-
60
50
40-
30-
20
10
109
50-
40
30-
20
10
Q
Expert Solution
This question has been solved!
Explore an expertly crafted, step-by-step solution for a thorough understanding of key concepts.

Step by step
Solved in 5 steps

Recommended textbooks for you
Glencoe Algebra 1, Student Edition, 9780079039897…
Algebra
ISBN:
9780079039897
Author:
Carter
Publisher:
McGraw Hill
Glencoe Algebra 1, Student Edition, 9780079039897…
Algebra
ISBN:
9780079039897
Author:
Carter
Publisher:
McGraw Hill