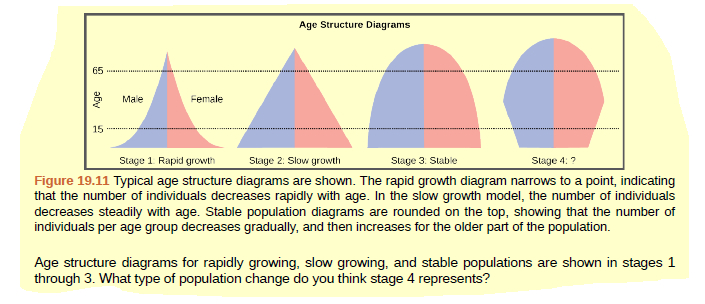
Age Structure Diagrams 65 ... .. Male Female 15 Stage 1 Rapid growth Stage 2: Slow growth Stage 3. Stable Stage 4: ? Figure 19.11 Typical age structure diagrams are shown. The rapid growth diagram narrows to a point, indicating that the number of individuals decreases rapidly with age. In the slow growth model, the number of individuals decreases steadily with age. Stable population diagrams are rounded on the top, showing that the number of individuals per age group decreases gradually, and then increases for the older part of the population. Age structure diagrams for rapidly growing, slow growing, and stable populations are shown in stages 1 through 3. What type of population change do you think stage 4 represents?
Age Structure Diagrams 65 ... .. Male Female 15 Stage 1 Rapid growth Stage 2: Slow growth Stage 3. Stable Stage 4: ? Figure 19.11 Typical age structure diagrams are shown. The rapid growth diagram narrows to a point, indicating that the number of individuals decreases rapidly with age. In the slow growth model, the number of individuals decreases steadily with age. Stable population diagrams are rounded on the top, showing that the number of individuals per age group decreases gradually, and then increases for the older part of the population. Age structure diagrams for rapidly growing, slow growing, and stable populations are shown in stages 1 through 3. What type of population change do you think stage 4 represents?

Biology: The Dynamic Science (MindTap Course List)
4th Edition
ISBN:9781305389892
Author:Peter J. Russell, Paul E. Hertz, Beverly McMillan
Publisher:Peter J. Russell, Paul E. Hertz, Beverly McMillan
Chapter52: Population Ecology
Section: Chapter Questions
Problem 5TYK

Related questions

Concept explainers
Population Growth
R and K Selection
R and K selection are concepts in ecology used to describe traits in the fluctuation of a population or population dynamics. For example, they describe the life-association traits between parent and offspring, such as quantity or number of young ones born at a time, quality of parental care, the age to maturity, and reproductive effort.
Question
Figure 19.11 Age structure diagrams for rapidly growing, slow growing, and stable populations are shown in stages 1 through 3. What type of population change do you think stage 4 represents?
Transcribed Image Text:Age Structure Diagrams
65
... ..
Male
Female
15
Stage 1 Rapid growth
Stage 2: Slow growth
Stage 3. Stable
Stage 4: ?
Figure 19.11 Typical age structure diagrams are shown. The rapid growth diagram narrows to a point, indicating
that the number of individuals decreases rapidly with age. In the slow growth model, the number of individuals
decreases steadily with age. Stable population diagrams are rounded on the top, showing that the number of
individuals per age group decreases gradually, and then increases for the older part of the population.
Age structure diagrams for rapidly growing, slow growing, and stable populations are shown in stages 1
through 3. What type of population change do you think stage 4 represents?
Expert Solution
This question has been solved!
Explore an expertly crafted, step-by-step solution for a thorough understanding of key concepts.

This is a popular solution!

Trending now
This is a popular solution!

Step by step
Solved in 4 steps

Knowledge Booster


Learn more about
Need a deep-dive on the concept behind this application? Look no further. Learn more about this topic, biology and related others by exploring similar questions and additional content below.Recommended textbooks for you
Biology: The Dynamic Science (MindTap Course List)
Biology
ISBN:
9781305389892
Author:
Peter J. Russell, Paul E. Hertz, Beverly McMillan
Publisher:
Cengage Learning

Biology: The Unity and Diversity of Life (MindTap…
Biology
ISBN:
9781337408332
Author:
Cecie Starr, Ralph Taggart, Christine Evers, Lisa Starr
Publisher:
Cengage Learning

Biology: The Unity and Diversity of Life (MindTap…
Biology
ISBN:
9781305073951
Author:
Cecie Starr, Ralph Taggart, Christine Evers, Lisa Starr
Publisher:
Cengage Learning
Biology: The Dynamic Science (MindTap Course List)
Biology
ISBN:
9781305389892
Author:
Peter J. Russell, Paul E. Hertz, Beverly McMillan
Publisher:
Cengage Learning
Biology: The Unity and Diversity of Life (MindTap…
Biology
ISBN:
9781337408332
Author:
Cecie Starr, Ralph Taggart, Christine Evers, Lisa Starr
Publisher:
Cengage Learning
Biology: The Unity and Diversity of Life (MindTap…
Biology
ISBN:
9781305073951
Author:
Cecie Starr, Ralph Taggart, Christine Evers, Lisa Starr
Publisher:
Cengage Learning

Concepts of Biology
Biology
ISBN:
9781938168116
Author:
Samantha Fowler, Rebecca Roush, James Wise
Publisher:
OpenStax College

Biology 2e
Biology
ISBN:
9781947172517
Author:
Matthew Douglas, Jung Choi, Mary Ann Clark
Publisher:
OpenStax
