Aggregate demand, aggregate supply, and the Phillips curve In the year 2027, aggregate demand and aggregate supply in the imaginary country of Daisen-Oki are represented by the curves AD 2027 and AS on the following graph. The price level is currently 102. The graph also shows two potential outcomes for 2028. The first possible aggregate demand curve is given by the curve labeled AD(a) curve, resulting in the outcome given by point A. The second possible aggregate demand curve is given by the curve labeled AD(b), resulting in the outcome given by point B. Suppose the unemployment rate is 7% under one of these two outcomes and 6% under the other. Based on the previous graph, you would expect (OUTCOME A or OUTCOME B) to be associated with the higher unemployment rate (7%). If aggregate demand is high in 2028, and the economy is at outcome B, the inflation rate between 2027 and 2028 is (1.96% or 5.00% or 4.00% or 2.94%). Based on your answers to the previous questions, on the following graph use the purple point (diamond symbol) to plot the unemployment rate and inflation rate if the economy is at point A. Next, use the green point (triangle symbol) to plot the unemployment rate and inflation rate if the economy is at point B. (As you place these points, dashed drop lines will automatically extend to both axes.) Finally, use the black line (cross symbol) to draw the short-run Phillips curve for this economy in 2028. Note: For graphing pruposes, round the inflation rate under each outcome to the nearest whole percent. For example, round 1.9% to 2.0%. Hint: Hover your cursor over each point after you plot it to make sure you have placed it on the exact coordinate you intended. Suppose that the government is considering enacting an expansionary policy in 2027 that would shift aggregate demand in 2028 from AD(a) to AD(b). This would cause a (SHIFT OF or MOVEMENT ALONG) the short-run Phillips curve, resulting in (AN INCREASE or A DECREASE) in the inflation rate and (A DCREASE or AN INCREASE) in the unemployment rate.
Aggregate demand, aggregate supply, and the Phillips curve In the year 2027, aggregate demand and aggregate supply in the imaginary country of Daisen-Oki are represented by the curves AD 2027 and AS on the following graph. The price level is currently 102. The graph also shows two potential outcomes for 2028. The first possible aggregate demand curve is given by the curve labeled AD(a) curve, resulting in the outcome given by point A. The second possible aggregate demand curve is given by the curve labeled AD(b), resulting in the outcome given by point B. Suppose the unemployment rate is 7% under one of these two outcomes and 6% under the other. Based on the previous graph, you would expect (OUTCOME A or OUTCOME B) to be associated with the higher unemployment rate (7%). If aggregate demand is high in 2028, and the economy is at outcome B, the inflation rate between 2027 and 2028 is (1.96% or 5.00% or 4.00% or 2.94%). Based on your answers to the previous questions, on the following graph use the purple point (diamond symbol) to plot the unemployment rate and inflation rate if the economy is at point A. Next, use the green point (triangle symbol) to plot the unemployment rate and inflation rate if the economy is at point B. (As you place these points, dashed drop lines will automatically extend to both axes.) Finally, use the black line (cross symbol) to draw the short-run Phillips curve for this economy in 2028. Note: For graphing pruposes, round the inflation rate under each outcome to the nearest whole percent. For example, round 1.9% to 2.0%. Hint: Hover your cursor over each point after you plot it to make sure you have placed it on the exact coordinate you intended. Suppose that the government is considering enacting an expansionary policy in 2027 that would shift aggregate demand in 2028 from AD(a) to AD(b). This would cause a (SHIFT OF or MOVEMENT ALONG) the short-run Phillips curve, resulting in (AN INCREASE or A DECREASE) in the inflation rate and (A DCREASE or AN INCREASE) in the unemployment rate.
Principles of Economics 2e
2nd Edition
ISBN:9781947172364
Author:Steven A. Greenlaw; David Shapiro
Publisher:Steven A. Greenlaw; David Shapiro
Chapter22: Inflation
Section: Chapter Questions
Problem 18RQ: What is deflation?
Related questions
Question
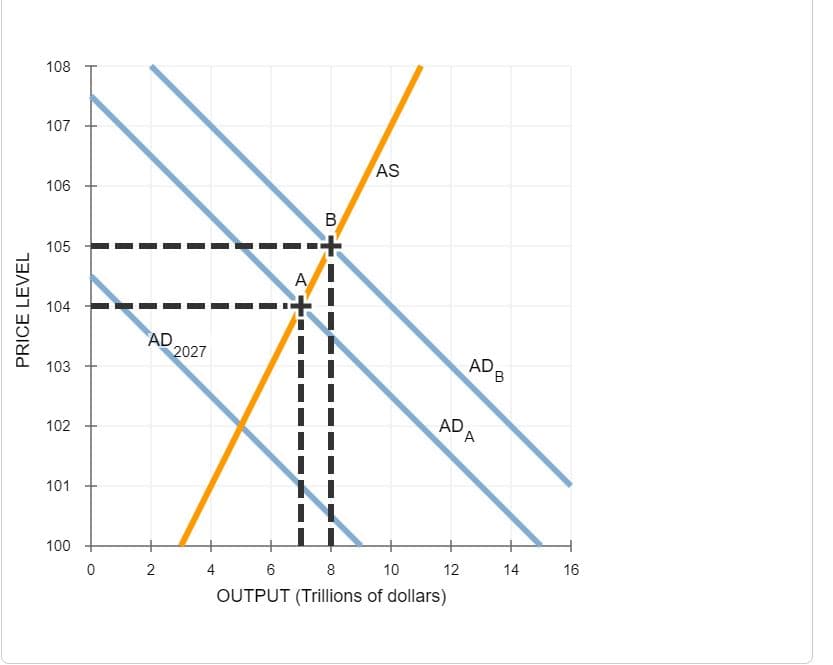
Aggregate demand, aggregate supply , and the Phillips curve
In the year 2027, aggregate demand and aggregate supply in the imaginary country of Daisen-Oki are represented by the curves AD 2027 and AS on the following graph. The price level is currently 102. The graph also shows two potential outcomes for 2028. The first possible aggregate demand curve is given by the curve labeled AD(a) curve, resulting in the outcome given by point A. The second possible aggregate demand curve is given by the curve labeled AD(b), resulting in the outcome given by point B.
Suppose the unemployment rate is 7% under one of these two outcomes and 6% under the other. Based on the previous graph, you would expect (OUTCOME A or OUTCOME B) to be associated with the higher unemployment rate (7%).
If aggregate demand is high in 2028, and the economy is at outcome B, the inflation rate between 2027 and 2028 is (1.96% or 5.00% or 4.00% or 2.94%).
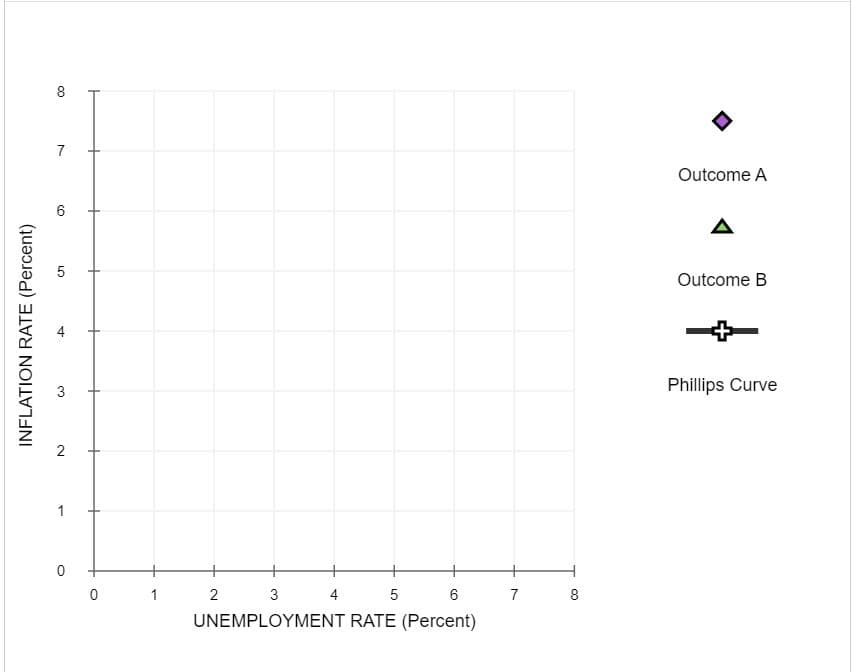
Based on your answers to the previous questions, on the following graph use the purple point (diamond symbol) to plot the unemployment rate and inflation rate if the economy is at point A. Next, use the green point (triangle symbol) to plot the unemployment rate and inflation rate if the economy is at point B. (As you place these points, dashed drop lines will automatically extend to both axes.) Finally, use the black line (cross symbol) to draw the short-run Phillips curve for this economy in 2028.
Note: For graphing pruposes, round the inflation rate under each outcome to the nearest whole percent. For example, round 1.9% to 2.0%.
Hint: Hover your cursor over each point after you plot it to make sure you have placed it on the exact coordinate you intended.
Suppose that the government is considering enacting an expansionary policy in 2027 that would shift aggregate demand in 2028 from AD(a) to AD(b). This would cause a (SHIFT OF or MOVEMENT ALONG) the short-run Phillips curve, resulting in (AN INCREASE or A DECREASE) in the inflation rate and (A DCREASE or AN INCREASE) in the unemployment rate.

Transcribed Image Text:PRICE LEVEL
108
107
106
105
104
103
102
101
100
AD
0 2
2027
4
ACHI
A
B
+
--
▬▬
II
AS
AD
6
8
10
OUTPUT (Trillions of dollars)
12
AD
A
B
14
16

Transcribed Image Text:INFLATION RATE (Percent)
8
7
6
5
3
2
0
0
1
3
5
6
UNEMPLOYMENT RATE (Percent)
2
4
7
00
8
Outcome A
A
Outcome B
Phillips Curve
Expert Solution
This question has been solved!
Explore an expertly crafted, step-by-step solution for a thorough understanding of key concepts.
This is a popular solution!
Trending now
This is a popular solution!
Step by step
Solved in 4 steps with 1 images

Knowledge Booster
Learn more about
Need a deep-dive on the concept behind this application? Look no further. Learn more about this topic, economics and related others by exploring similar questions and additional content below.Recommended textbooks for you

Principles of Economics 2e
Economics
ISBN:
9781947172364
Author:
Steven A. Greenlaw; David Shapiro
Publisher:
OpenStax

Principles of Economics 2e
Economics
ISBN:
9781947172364
Author:
Steven A. Greenlaw; David Shapiro
Publisher:
OpenStax