不 al exam, are asked to respond variety background questions. For the 41 nations that participated in the exam, the correlation between the percentage of items answered in the background questionnaire (used as a proxy for student task persistence) and mean score on the exam was 0.889. Does this suggest there is a linear relation between student task persistence and achievement score? Write a sentence that explains what this result might mean. Click the icon to view the critical values table. Does this suggest there is a linear relation between student task persistence and achievement score? Choose the best response below. A. Yes, since |0.889| is less than the critical value for 30. OB. Yes, since |0.889 is greater than the critical value for 30. O C. No, since |0.889 is greater than the critical value for 30. OD. No, since |0.889 is less than the critical value for 30. X
不 al exam, are asked to respond variety background questions. For the 41 nations that participated in the exam, the correlation between the percentage of items answered in the background questionnaire (used as a proxy for student task persistence) and mean score on the exam was 0.889. Does this suggest there is a linear relation between student task persistence and achievement score? Write a sentence that explains what this result might mean. Click the icon to view the critical values table. Does this suggest there is a linear relation between student task persistence and achievement score? Choose the best response below. A. Yes, since |0.889| is less than the critical value for 30. OB. Yes, since |0.889 is greater than the critical value for 30. O C. No, since |0.889 is greater than the critical value for 30. OD. No, since |0.889 is less than the critical value for 30. X

Glencoe Algebra 1, Student Edition, 9780079039897, 0079039898, 2018
18th Edition
ISBN:9780079039897
Author:Carter
Publisher:Carter
Chapter4: Equations Of Linear Functions
Section4.5: Correlation And Causation
Problem 15PPS

Related questions
Question
Transcribed Image Text:2:23
K
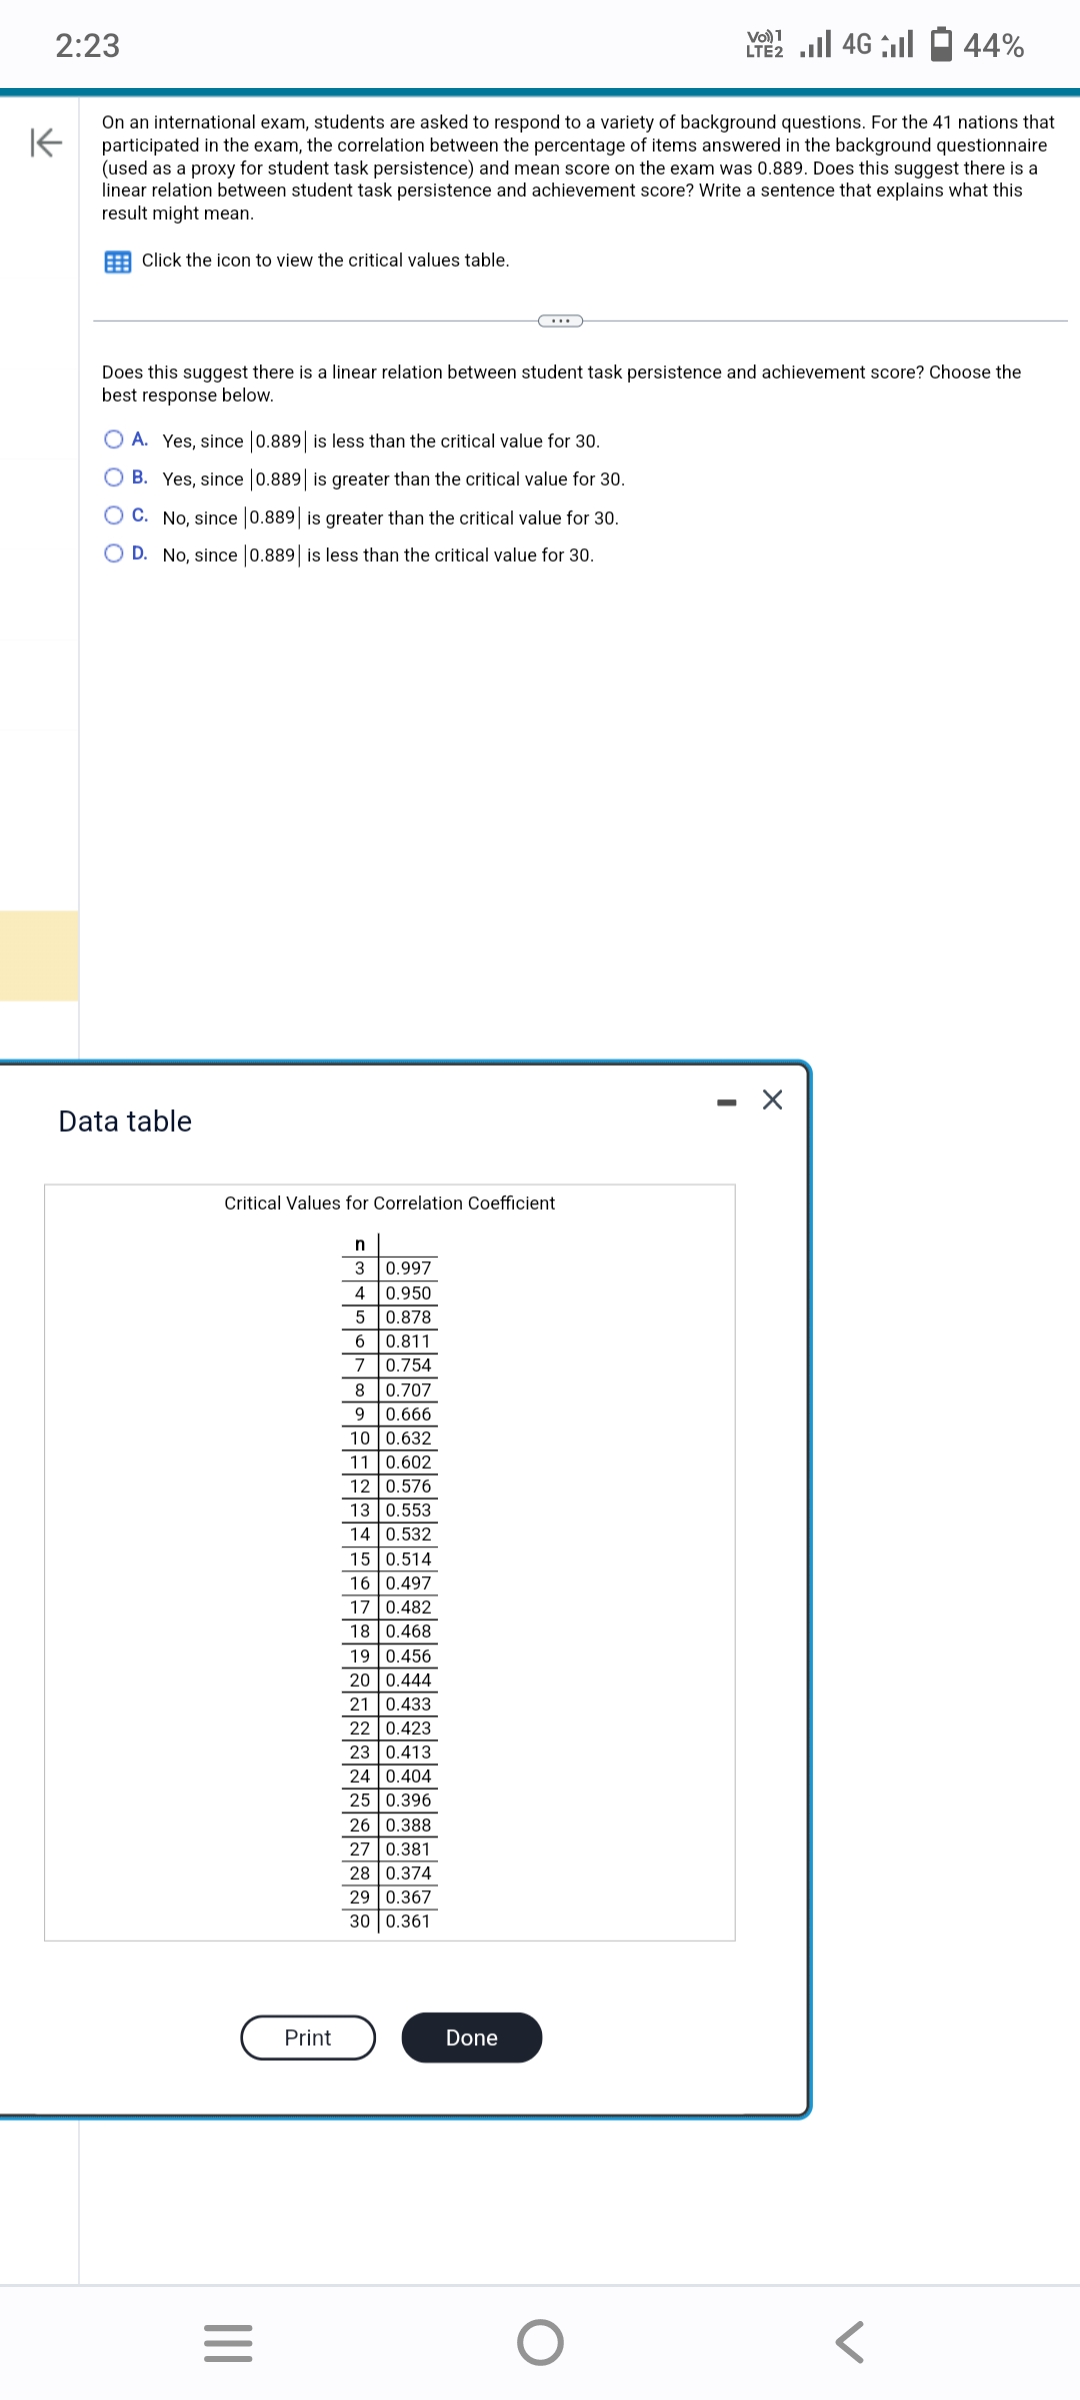
On an international exam, students are asked to respond to a variety of background questions. For the 41 nations that
participated in the exam, the correlation between the percentage of items answered in the background questionnaire
(used as a proxy for student task persistence) and mean score on the exam was 0.889. Does this suggest there is a
linear relation between student task persistence and achievement score? Write a sentence that explains what this
result might mean.
Click the icon to view the critical values table.
OA. Yes, since |0.889| is less than the critical value for 30.
B. Yes, since 0.889 is greater than the critical value for 30.
OC. No, since |0.889 is greater than the critical value for 30.
O D. No, since |0.889 is less than the critical value for 30.
Does this suggest there is a linear relation between student task persistence and achievement score? Choose the
best response below.
Data table
Critical Values for Correlation Coefficient
|||
=
Print
n
3 0.997
4
0.950
5 0.878
6 0.811
7 0.754
8 0.707
9 0.666
10 0.632
11 0.602
12 0.576
13 0.553
14 0.532
15 0.514
16 0.497
17 0.482
18 0.468
19 0.456
20 0.444
21 0.433
22 0.423
23 0.413
24 0.404
25 0.396
26 0.388
27 0.381
28 0.374
29 0.367
30 0.361
Done
1
LTE2.II 4G
O
I
44%
X
Expert Solution
This question has been solved!
Explore an expertly crafted, step-by-step solution for a thorough understanding of key concepts.

Step by step
Solved in 3 steps with 1 images

Recommended textbooks for you
Glencoe Algebra 1, Student Edition, 9780079039897…
Algebra
ISBN:
9780079039897
Author:
Carter
Publisher:
McGraw Hill
Glencoe Algebra 1, Student Edition, 9780079039897…
Algebra
ISBN:
9780079039897
Author:
Carter
Publisher:
McGraw Hill