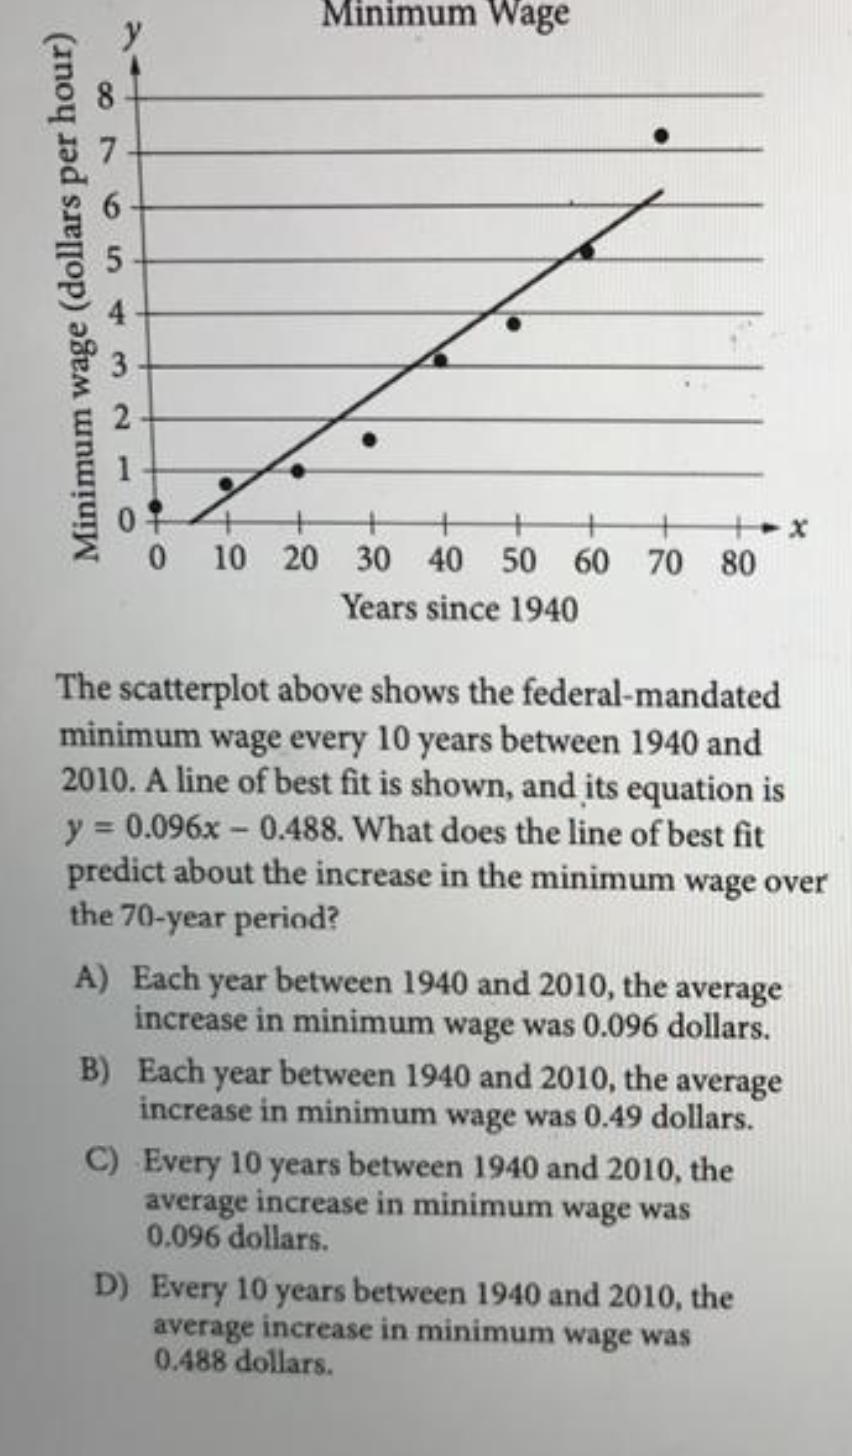
Minimum Wage y 8 0 10 20 30 40 50 60 70 80 Years since 1940 The scatterplot above shows the federal-mandated minimum wage every 10 years between 1940 and 2010. A line of best fit is shown, and its equation is y 0.096x - 0.488. What does the line of best fit predict about the increase in the minimum wage over the 70-year period? A) Each year between 1940 and 2010, the average increase in minimum wage was 0.096 dollars. B) Each year between 1940 and 2010, the average increase in minimum wage was 0.49 dollars. C) Every 10 years between 1940 and 2010, the average increase in minimum wage was 0.096 dollars. D) Every 10 years between 1940 and 2010, the average increase in minimum wage was 0.488 dollars. 6 5. 4, 3. Minimum wage (dollars per hour)
Minimum Wage y 8 0 10 20 30 40 50 60 70 80 Years since 1940 The scatterplot above shows the federal-mandated minimum wage every 10 years between 1940 and 2010. A line of best fit is shown, and its equation is y 0.096x - 0.488. What does the line of best fit predict about the increase in the minimum wage over the 70-year period? A) Each year between 1940 and 2010, the average increase in minimum wage was 0.096 dollars. B) Each year between 1940 and 2010, the average increase in minimum wage was 0.49 dollars. C) Every 10 years between 1940 and 2010, the average increase in minimum wage was 0.096 dollars. D) Every 10 years between 1940 and 2010, the average increase in minimum wage was 0.488 dollars. 6 5. 4, 3. Minimum wage (dollars per hour)

Algebra & Trigonometry with Analytic Geometry
13th Edition
ISBN:9781133382119
Author:Swokowski
Publisher:Swokowski
Chapter7: Analytic Trigonometry
Section7.6: The Inverse Trigonometric Functions
Problem 93E

Related questions
Question
Transcribed Image Text:Minimum Wage
y
8
0 10 20 30 40 50 60 70 80
Years since 1940
The scatterplot above shows the federal-mandated
minimum wage every 10 years between 1940 and
2010. A line of best fit is shown, and its equation is
y 0.096x - 0.488. What does the line of best fit
predict about the increase in the minimum wage over
the 70-year period?
A) Each year between 1940 and 2010, the average
increase in minimum wage was 0.096 dollars.
B) Each year between 1940 and 2010, the average
increase in minimum wage was 0.49 dollars.
C) Every 10 years between 1940 and 2010, the
average increase in minimum wage was
0.096 dollars.
D) Every 10 years between 1940 and 2010, the
average increase in minimum wage was
0.488 dollars.
6
5.
4,
3.
Minimum wage (dollars per hour)
Expert Solution
This question has been solved!
Explore an expertly crafted, step-by-step solution for a thorough understanding of key concepts.

This is a popular solution!

Trending now
This is a popular solution!

Step by step
Solved in 2 steps with 2 images

Recommended textbooks for you
Algebra & Trigonometry with Analytic Geometry
Algebra
ISBN:
9781133382119
Author:
Swokowski
Publisher:
Cengage
Algebra & Trigonometry with Analytic Geometry
Algebra
ISBN:
9781133382119
Author:
Swokowski
Publisher:
Cengage