Q: Find the domain and range of this relation { (x, y) RxR: V+3}?
A: Given query is to find the domain and range ofbthe relation.
Q: 2. Given the graphs of f(x) and g(x) as shown, find: ✓✓✓✓ a) f(g(0)) b) f(g(2)) 67. -20 -2-
A: f(g(0))=? f(g(2))=?
Q: Determine whether the statement below is true or false. To obtain the graph of f(x) = Vx+2, shift…
A:
Q: Use the graph of f(x) = e* below to complete part a and b below.
A: Given:- The function is, f(x)=ex and the graph is, To find: - The value of limx→-∞ex
Q: Use the graph of f to find the x-intercept(s), Where applicable, use interval notation.
A:
Q: 10 y = ((x)
A:
Q: Sketch the graph of glx) = 2?J x + . Support the graph by a table
A:
Q: F1
A: Please find attachment for the details solution
Q: Identify the level curve of the function f(x, y) for c 8. x2 Write your answer in terms of y as a…
A: NOTE: Refresh your page if you can't see any equations. . the given function is here we have c=8 so…
Q: 32. Given the dotted graph of y = f (x), graph the function y = /f(x). %3D a) b) GIGLU
A: Let's find.
Q: State the intervals where the graph of y = sec(r),-2n <I< 27, is decreasing.
A:
Q: For a function f(x), f"(a) = 0 and f"(a) = 0. What could be true of the point (a, fla))? Explain.…
A: Given f'a=0and f''a=0
Q: For the following exercise, sketch the graph of the equation. 43. g(x) = -
A: The function is f(x)=2x3-12
Q: r+3 Draw the graph of f(a): %3D 10
A: Graph is given below
Q: . Does the graph of y = Vi - In x, x > 0, have an inflection point? Try to answer the question (a)…
A: y=x-lnx
Q: What is the graph represented by the function f(t) = t + (t - 2)u(t - 1)
A:
Q: Starting with the graph of f(x) = 2", write the equation of the graph that results from a. shifting…
A: NOTE: Refresh your page if you can't see any equations. . the base function is the graph of the is…
Q: Explain why g(x) = across the y-axis, or by shifting the graph of f one unit to the right and…
A:
Q: e) Sketch the graph of y= f'(2).
A:
Q: Q16) Use shifting graph to sketch a) y = |(x – 3)² – 2| b) y = -1+ 5cos (x –-)
A: Given a y=x-32-2b y=-1+5cosx-π2
Q: Dvaw the graph for the function y- Find (Pp) & (RE) and then %3D X-2
A: To draw the graph of the function, we need to simplify the function as below:…
Q: Determine whether the statement is true or false. If it is false, explain why or give an example…
A: The graphs of f and g interest midway between x=a and x=b then∫abfx-gxdx=0. While the graphs of the…
Q: What is the domain and the range of y = sec x?
A: y=sec x or y=1cos x∴ sec x is undefined at cos x=0cos nπ+π2=0 ∴ x≠ nπ+π2 Thus, the domain of the…
Q: left, right, upward, downward (a) How is the graph of y = f(x - 2) +1 obtained from the graph of f?…
A: Given (a) y=f(x-2)+1
Q: Starting with the graph of f(x) = 9ª, write the equation of the graph that results from a.…
A: Since you have asked multiple question As per our policy, we will solve the first question for…
Q: The graph of the relation T is shown below. y. 2. 4 Give the domain and range of T.
A: From the given graph, the ordered pairs are -4,4,-2,0,-1,-1 and 1,-2. Here the domain is all the…
Q: The altitude (in feet) of a rocket t sec into flight is given by s = f(t) = −t 3 + 54t 2 + 480t + 6…
A: We have to find point of inflection where graph changes their sign like increasing to decreasing or…
Q: Find the point of inflection of the graph of the function. (If an answer does not exist, enter DNE.)…
A:
Q: Determine whether the statement is true or false. If it is false, explain why or give an example…
A: the given function, f(x)=ex and g(x)=e-xhere , f(x)=exdifferentiate the f(x) with respect to x , we…
Q: Use the graph of y = f(x) to sketch the graph of f'(x). 10+
A: The given graph is:
Q: Use the graph of y = f(x) to sketch the graph of f '(x). 3. 2- -37/2 /2 T/2 37/2 27 -1- -3. Draw: M…
A: Given data :
Q: I. Sketch the graph of a function and determine its domain and range. 1. {x? +y? = 8} 2. Н(х) %3D 16…
A: graph of x^2+y^2=8
Q: Use the graphs below to estimate g(f(3)). 3 3 f(x) g(x) -3 3 -3 Give your answer correct to one…
A: From the given figure of f(x), we can see that f(3)=1.5. So, g(f(3)) = g(1.5). From the graph g(x),…
Q: y = f(x), 하 4- 3- 2 -5 -4 -3 --1 45
A: Definition used - Horizontal shift - The graph of a function f(x)…
Q: Use the graph to enter an equation for f(t).
A: In this problem, we have to find the path equation f(t) by using the given point and given equation…
Q: Explain how to identify the graph of : Ax2 + Cy2 + Dx + Ey + F = 0.
A: If an equation has a square form of the variable or a square form of the variable or a square form…
Q: Explain how the graph of g is obtained from the graph of f. (a) f(x) = x, g(x) = − x +…
A:
Q: Use the graph of y = f(x) in the accompanying figure to estimate the value of f'(1), f'(3), f'(5),…
A: Result: Derivative at a point x=a will represent the slope of tangent line to the curve y=f(x) at…
Q: Starting with the graph of f(x) = 5ª, write the equation of the graph that results when: (a) f(x) is…
A:
Q: 28. Use the graph below to determine the equation of h(x).
A:
Q: Explain with drawing the effect of increasing of each value of (A,B and C) on graph of…
A: The given function is: y=A+B sin (Cx)
Q: Sketch the graph of the solution and describe its behavior as t increases: 4y″ − y = 0, y(−2) =…
A:
Q: | f()dt. Refer to the graph shown below to evaluate - 2 5- t-2 -4 7-4 -5-
A:
Q: Sketch the graph of the following fu f(x) = (x + 3)4 he correct graph below OC.
A:
Q: Explain with drawing the effect of increasing of each value of (A. B and C) on graph of y=A+ B.…
A:
Q: f(r) dax 9. Use the graph of f(x) below to evaluate 19 (a) 9 (b) 2 (c) 2 (d) 5 (e) 2 Graph of y f(x)
A: Evaluate:
Q: what are the steps to graphing f(x)=e^(-x/2)
A: Steps to graphing an exponential function: 1. Draw the graph of the general exponential function. 2.…
Q: (c) Consider the following graph of a function y = f(x): 5
A:
Q: Sketch the graph of the function. y = e−x/2
A: Graph of the function y = e-x2
Q: how can I traslate this to graph using given function? with T- chart g(x) = √x-2 h(x) = √x+3
A: Given functions are g(x) = x-2 h(x) = x+3 First draw the graph of g(x) To draw h(x), with…
see below attached image for question
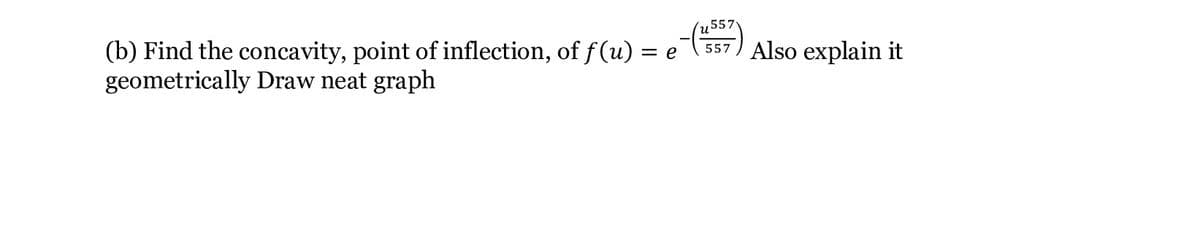
Step by step
Solved in 2 steps with 2 images
- How to graph it using Rolle's Theorem and Intermediate Value Theorem?Find all points (if any) of horizontal and vertical tangency to the curve x = cos2 θ, y = cos θ. Use a graphing utility to confirm your results.Sketch the graphs of f(x) = arccos (cos(x)) and g(x)= cos(arccos(x)) on the separateaxes below. Explain, in terms of the meaning of the input and output quantities of thesefunctions, why your graphs look as they do. Your graphs should clearly indicate the domainand range of the functions f and g.
- Consider the function y = 2 cos 4 x + 1 for {x|0° x 360°} Describe the graph by stating the amplitude, equation of the midline, range, period and any horizontal translation of y = cos x Confirm your description using graphing technologyI need help solving this question using the trapezoidal rule . also sketch function , make table of values?Find all points (if any) of horizontal and vertical tangency to the curve x = cos θ, y = 2 sin 2θ . Use a graphing utility to confirm your results.
- Explain how the amplitude and period of a sinusoidal graphare used to establish the scale on each coordinate axis.102. Find an application in your major field that leads tFind the point of inflection and discuss the concavity of the graph of the function. f(x) = sin x/4, [0, 8?]Sketch the graph of f (x) = sin x on [0, π,] and guess the value of f ' (π,/2). Then calculate the difference quotient at x = π/2 for two small positive and negative values of h. Are these calculations consistent with your guess?