Among 25- to 30-year-olds, 28% say they have operated heavy machinery while under the influence of alcohol. Suppose three 25- to 30-year-olds are selected at random. Complete parts (a) through (d) below. (a) What is the probability that all three have operated heavy machinery while under the influence of alcohol? (Round to four decimal places as needed.) (b) What is the probability that at least one has not operated heavy machinery while under the influence of alcohol? (Round to four decimal places as needed.) (c) What is the probability that none of the three have operated heavy machinery while under the influence of alcohol? (Round to four decimal places as needed.) (d) What is the probability that at least one has operated heavy machinery while under the influence of alcohol? (Round to four decimal nlares ac neaded i
Among 25- to 30-year-olds, 28% say they have operated heavy machinery while under the influence of alcohol. Suppose three 25- to 30-year-olds are selected at random. Complete parts (a) through (d) below. (a) What is the probability that all three have operated heavy machinery while under the influence of alcohol? (Round to four decimal places as needed.) (b) What is the probability that at least one has not operated heavy machinery while under the influence of alcohol? (Round to four decimal places as needed.) (c) What is the probability that none of the three have operated heavy machinery while under the influence of alcohol? (Round to four decimal places as needed.) (d) What is the probability that at least one has operated heavy machinery while under the influence of alcohol? (Round to four decimal nlares ac neaded i

Chapter8: Sequences, Series,and Probability
Section8.7: Probability
Problem 11ECP: A manufacturer has determined that a machine averages one faulty unit for every 500 it produces....

Related questions

Concept explainers
Contingency Table
A contingency table can be defined as the visual representation of the relationship between two or more categorical variables that can be evaluated and registered. It is a categorical version of the scatterplot, which is used to investigate the linear relationship between two variables. A contingency table is indeed a type of frequency distribution table that displays two variables at the same time.
Binomial Distribution
Binomial is an algebraic expression of the sum or the difference of two terms. Before knowing about binomial distribution, we must know about the binomial theorem.
Topic Video
Question
14
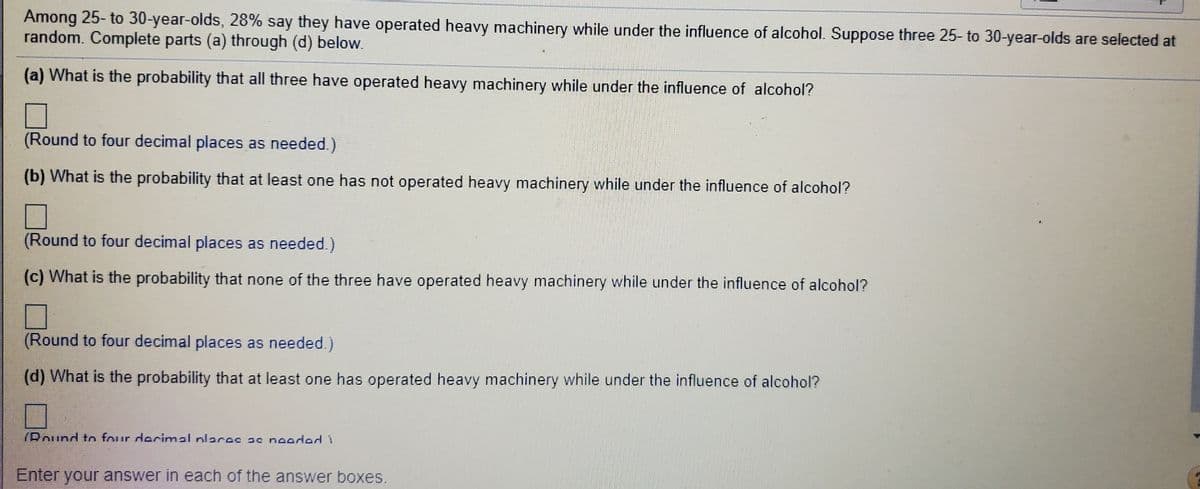
Transcribed Image Text:Among 25- to 30-year-olds, 28% say they have operated heavy machinery while under the influence of alcohol. Suppose three 25- to 30-year-olds are selected at
random. Complete parts (a) through (d) below.
(a) What is the probability that all three have operated heavy machinery while under the influence of alcohol?
(Round to four decimal places as needed.)
(b) What is the probability that at least one has not operated heavy machinery while under the influence of alcohol?
(Round to four decimal places as needed.)
(c) What is the probability that none of the three have operated heavy machinery while under the influence of alcohol?
(Round to four decimal places as needed.)
(d) What is the probability that at least one has operated heavy machinery while under the influence of alcohol?
(Round ton four decimal nlaces ac noodod
Enter your answer in each of the answer boxes.
Expert Solution
This question has been solved!
Explore an expertly crafted, step-by-step solution for a thorough understanding of key concepts.

This is a popular solution!

Trending now
This is a popular solution!

Step by step
Solved in 4 steps with 28 images

Knowledge Booster


Learn more about
Need a deep-dive on the concept behind this application? Look no further. Learn more about this topic, statistics and related others by exploring similar questions and additional content below.Recommended textbooks for you