Among various ethnic groups, the standard deviation of heights is known to be approximately three inches. Forty-eight male Swedes are surveyed. The sample mean is 71 inches. A 92% confidence interval for the population mean height of male Swedes is D (70.167,71.833 ) (71.167,72.833) (70.151,71.849)
Among various ethnic groups, the standard deviation of heights is known to be approximately three inches. Forty-eight male Swedes are surveyed. The sample mean is 71 inches. A 92% confidence interval for the population mean height of male Swedes is D (70.167,71.833 ) (71.167,72.833) (70.151,71.849)

Glencoe Algebra 1, Student Edition, 9780079039897, 0079039898, 2018
18th Edition
ISBN:9780079039897
Author:Carter
Publisher:Carter
Chapter10: Statistics
Section10.4: Distributions Of Data
Problem 7PPS

Related questions
Question
please slove first and second
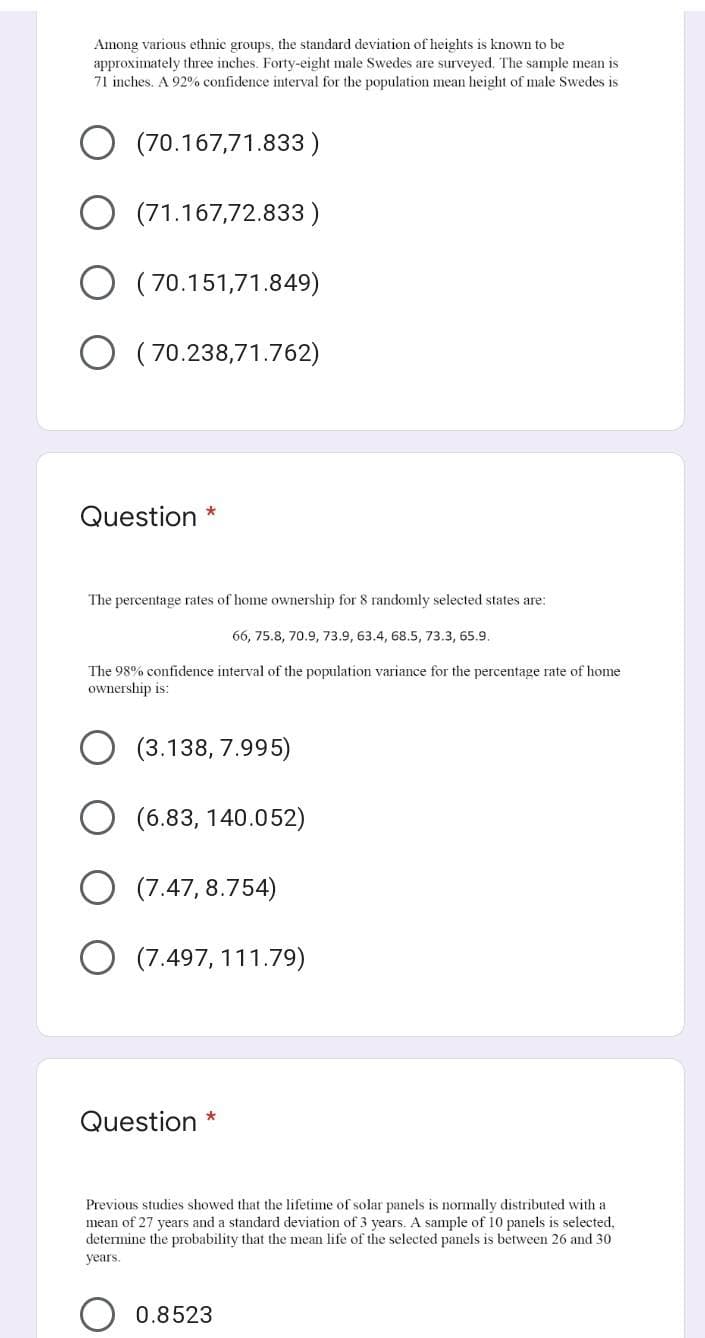
Transcribed Image Text:Among various ethnic groups, the standard deviation of heights is known to be
approximately three inches. Forty-eight male Swedes are surveyed. The sample mean is
71 inches. A 92% confidence interval for the population mean height of male Swedes is
(70.167,71.833 )
O (71.167,72.833 )
( 70.151,71.849)
( 70.238,71.762)
Question
The percentage rates of home ownership for 8 randomly selected states are:
66, 75.8, 70.9, 73.9, 63.4, 68.5, 73.3, 65.9.
The 98% confidence interval of the population variance for the percentage rate of home
ownership is:
(3.138, 7.995)
(6.83, 140.052)
(7.47, 8.754)
O (7.497, 111.79)
Question *
Previous studies showed that the lifetime of solar panels is normally distributed with a
mean of 27 years and a standard deviation of 3 years. A sample of 10 panels is selected,
determine the probability that the mean life of the selected panels is between 26 and 30
years.
0.8523
Expert Solution
This question has been solved!
Explore an expertly crafted, step-by-step solution for a thorough understanding of key concepts.

Step by step
Solved in 3 steps with 3 images

Recommended textbooks for you
Glencoe Algebra 1, Student Edition, 9780079039897…
Algebra
ISBN:
9780079039897
Author:
Carter
Publisher:
McGraw Hill
Glencoe Algebra 1, Student Edition, 9780079039897…
Algebra
ISBN:
9780079039897
Author:
Carter
Publisher:
McGraw Hill