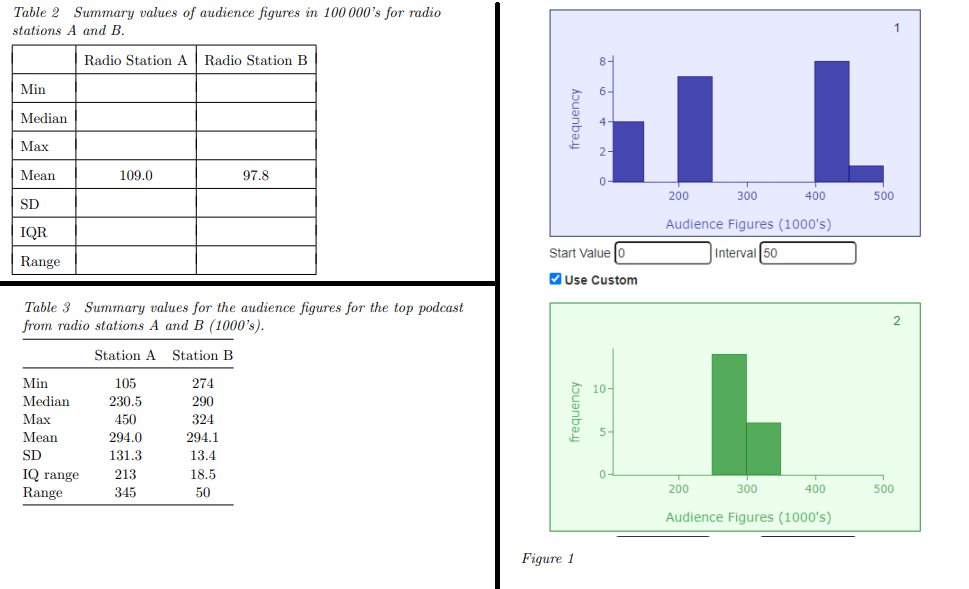
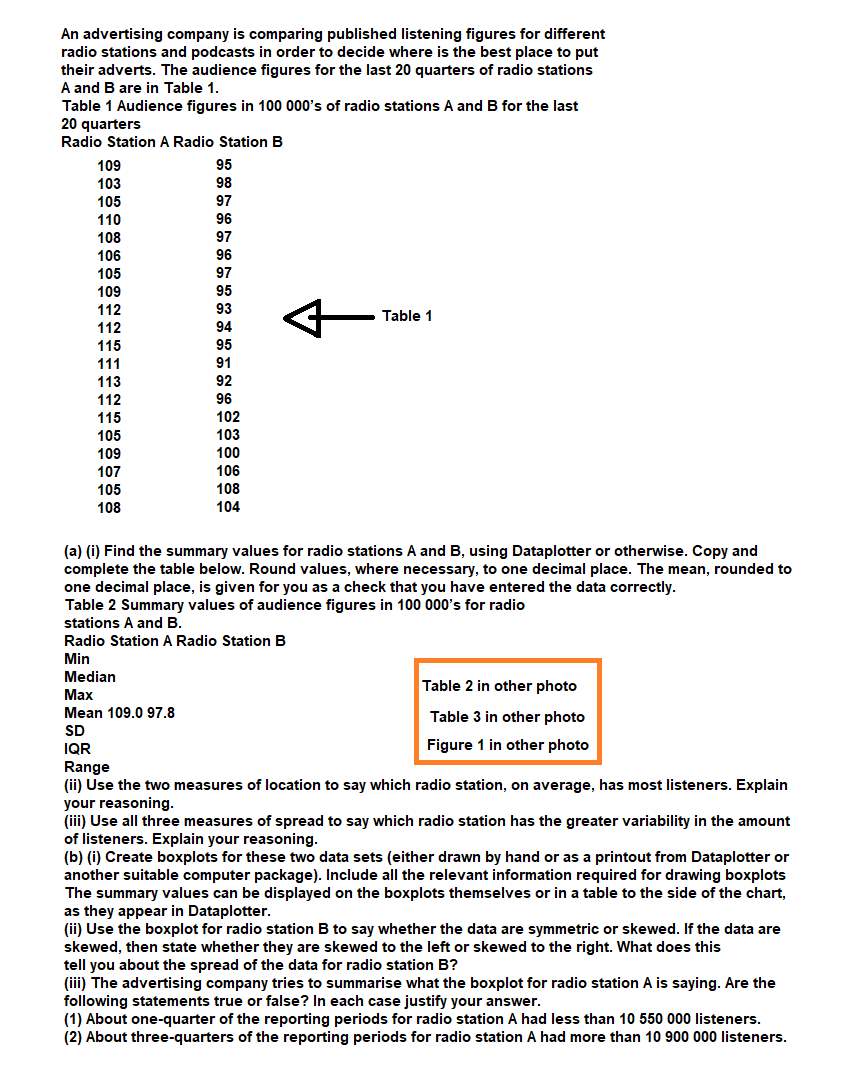
An advertising company is comparing published listening figures for different radio stations and podcasts in order to decide where is the best place to put their adverts. The audience figures for the last 20 quarters of radio stations A and B are in Table 1. Table 1 Audience figures in 100 000's of radio stations A and B for the last 20 quarters Radio Station A Radio Station B 109 95 103 98 105 97 110 96 108 97 106 96 105 97 109 95 93 112 112 Table 1 94 115 95 111 91 92 96 113 112 115 102 105 109 107 103 100 106 105 108 108 104 (a) (i) Find the summary values for radio stations A and B, using Dataplotter or otherwise. Copy and complete the table below. Round values, where necessary, to one decimal place. The mean, rounded to one decimal place, is given for you as a check that you have entered the data correctly. Table 2 Summary values of audience figures in 100 000's for radio stations A and B. Radio Station A Radio Station B Min Median Table 2 in other photo Max Mean 109.0 97.8 Table 3 in other photo SD IQR Figure 1 in other photo Range (ii) Use the two measures of location to say which radio station, on average, has most listeners. Explain your reasoning. (iii) Use all three measures of spread to say which radio station has the greater variability in the amount of listeners. Explain your reasoning. (b) (i) Create boxplots for these two data sets (either drawn by hand or as a printout from Dataplotter or another suitable computer package). Include all the relevant information required for drawing boxplots The summary values can be displayed on the boxplots themselves or in a table to the side of the chart, as they appear in Dataplotter. (ii) Use the boxplot for radio station B to say whether the data are symmetric or skewed. If the data are skewed, then state whether they are skewed to the left or skewed to the right. What does this tell vou about the spread of the data for radio station B?


Step by step
Solved in 4 steps

(b) (i) Create boxplots for these two data sets (either drawn by hand or as a printout from Dataplotter or another suitable computer package). Include all the relevant information required for drawing boxplots The summary values can be displayed on the boxplots themselves or in a table to the side of the chart, as they appear in Dataplotter.
(ii) Use the boxplot for radio station B to say whether the data are symmetric or skewed. If the data are skewed, then state whether they are skewed to the left or skewed to the right. What does this tell you about the spread of the data for radio station B?
(iii) The advertising company tries to summarise what the boxplot for radio station A is saying. Are the following statements true or false? In each case justify your answer.
(1) About one-quarter of the reporting periods for radio station A had less than 10 550 000 listeners. (2) About three-quarters of the reporting periods for radio station A had more than 10 900 000 listeners.
