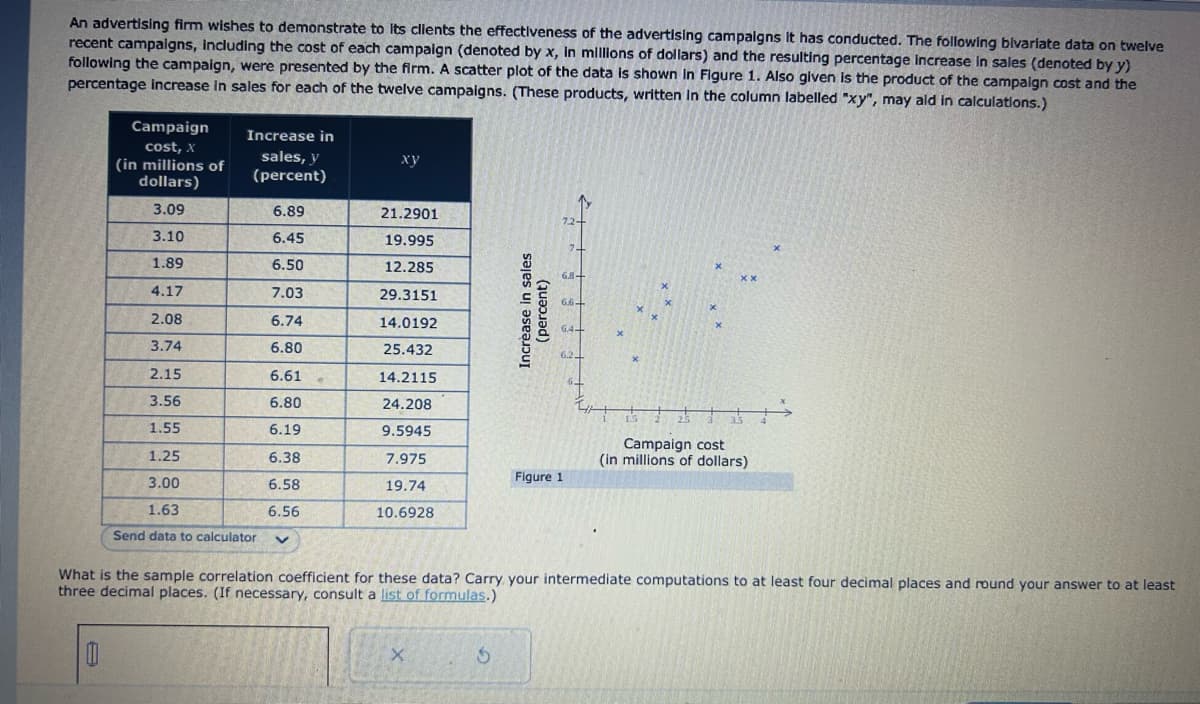
An advertising firm wishes to demonstrate to its clients the effectiveness of the advertising campaigns it has conducted. The following bivariate data on twelve recent campaigns, including the cost of each campaign (denoted by x, in millions of dollars) and the resulting percentage increase in sales (denoted by y) following the campaign, were presented by the firm. A scatter plot of the data is shown in Figure 1. Also given is the product of the campaign cost and the percentage increase in sales for each of the twelve campaigns. (These products, written in the column labelled "xy", may aid in calculations.) Campaign cost, X (in millions of dollars) 3.09 6.89 3.10 6.45 1.89 6.50 4.17 7.03 2.08 6.74 3.74 6.80 2.15 6.61 3.56 6.80 1.55 6.19 1.25 6.38 3.00 6.58 1.63 6.56 Send data to calculator V Increase in sales, y (percent) xy 21.2901 19.995 12.285 29.3151 14.0192 25.432 14.2115 24.208 9.5945 7.975 19.74 10.6928 Increase in sales (percent) 62+ Figure 1 x xx P Campaign cost (in millions of dollars) What is the sample correlation coefficient for these data? Carry your intermediate computations to at least four decimal places and round your answer to at least three decimal places. (If necessary, consult a list of formulas.)
An advertising firm wishes to demonstrate to its clients the effectiveness of the advertising campaigns it has conducted. The following bivariate data on twelve recent campaigns, including the cost of each campaign (denoted by x, in millions of dollars) and the resulting percentage increase in sales (denoted by y) following the campaign, were presented by the firm. A scatter plot of the data is shown in Figure 1. Also given is the product of the campaign cost and the percentage increase in sales for each of the twelve campaigns. (These products, written in the column labelled "xy", may aid in calculations.) Campaign cost, X (in millions of dollars) 3.09 6.89 3.10 6.45 1.89 6.50 4.17 7.03 2.08 6.74 3.74 6.80 2.15 6.61 3.56 6.80 1.55 6.19 1.25 6.38 3.00 6.58 1.63 6.56 Send data to calculator V Increase in sales, y (percent) xy 21.2901 19.995 12.285 29.3151 14.0192 25.432 14.2115 24.208 9.5945 7.975 19.74 10.6928 Increase in sales (percent) 62+ Figure 1 x xx P Campaign cost (in millions of dollars) What is the sample correlation coefficient for these data? Carry your intermediate computations to at least four decimal places and round your answer to at least three decimal places. (If necessary, consult a list of formulas.)

Linear Algebra: A Modern Introduction
4th Edition
ISBN:9781285463247
Author:David Poole
Publisher:David Poole
Chapter7: Distance And Approximation
Section7.3: Least Squares Approximation
Problem 31EQ

Related questions
Question
#10.
Transcribed Image Text:An advertising firm wishes to demonstrate to its clients the effectiveness of the advertising campaigns it has conducted. The following bivariate data on twelve
recent campaigns, including the cost of each campaign (denoted by x, in millions of dollars) and the resulting percentage increase in sales (denoted by y)
following the campaign, were presented by the firm. A scatter plot of the data is shown in Figure 1. Also given is the product of the campaign cost and the
percentage increase in sales for each of the twelve campaigns. (These products, written in the column labelled "xy", may aid in calculations.)
Campaign
cost, X
(in millions of
dollars)
3.09
3.10
1.89
A
4.17
2.08
3.74
2.15
3.56
1.55
1.25
3.00
Increase in
sales, y
(percent)
6.89
6.45
6.50
7.03
6.74
6.80
6.61
6.80
6.19
6.38
6.58
6.56
1.63
Send data to calculator V
xy
21.2901
19.995
12.285
29.3151
14.0192
25.432
14.2115
24.208
9.5945
7.975
19.74
10.6928
X
Increase in sales
(percent)
S
7.2+
7+
6.8+
6.6-
Figure 1
6.4+
6.2
x
1.5
x
What is the sample correlation coefficient for these data? Carry your intermediate computations to at least four decimal places and round your answer to at least
three decimal places. (If necessary, consult a list of formulas.)
xx
Campaign cost
(in millions of dollars)
Expert Solution
This question has been solved!
Explore an expertly crafted, step-by-step solution for a thorough understanding of key concepts.

This is a popular solution!

Trending now
This is a popular solution!

Step by step
Solved in 3 steps

Recommended textbooks for you
Linear Algebra: A Modern Introduction
Algebra
ISBN:
9781285463247
Author:
David Poole
Publisher:
Cengage Learning

Glencoe Algebra 1, Student Edition, 9780079039897…
Algebra
ISBN:
9780079039897
Author:
Carter
Publisher:
McGraw Hill
Linear Algebra: A Modern Introduction
Algebra
ISBN:
9781285463247
Author:
David Poole
Publisher:
Cengage Learning
Glencoe Algebra 1, Student Edition, 9780079039897…
Algebra
ISBN:
9780079039897
Author:
Carter
Publisher:
McGraw Hill