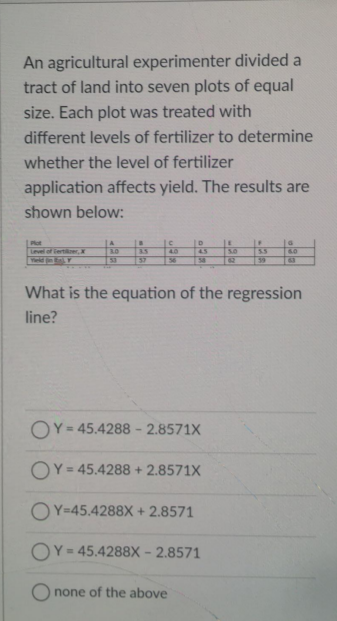
An agricultural experimenter divided a tract of land into seven plots of equal size. Each plot was treated with different levels of fertilizer to determine whether the level of fertilizer application affects yield. The results are shown below: 5O What is the equation of the regression line? OY= 45.4288 - 2.8571X OY= 45.4288 + 2.8571X OY=45.4288X + 2.8571 OY- 45.4288X - 2.8571 O none of the above


Q: Find the equation of the regression line for the given data. Round values to the nearest thousandth.…
A:
Q: For a multiple regression model, SSR = 600 and SSE = 200. The multiple coefficient of determination…
A: Givensum of squares of Residuals(SSR)=600sum of squared estimated of errors(SSE)=200
Q: The following data are the monthly salaries and the grade point averages for students who obtained a…
A: For the given data compute the simple linear regression equation is
Q: The table below shows the number of state-registered automatic weapons and the murder rate for…
A:
Q: A Math teacher wishes to determine if the number of absences a student incurs correlates with his or…
A:
Q: A ski resort asked a random sample of guests to rate their satisfaction on various attributes of…
A: Note: Hey, since multiple subparts are posted, we will answer first three subparts according to our…
Q: Given a set of data that has the following measures, find the least square regression line
A: The regression line is,…
Q: The marketing manager of a supermarket chain would like to determine the effect of shelf space on…
A: SUMMARY OUTPUT Regression Statistics Multiple R 0.736589…
Q: The table below shows the numbers of new-vehicle sales (in thousands) for Company 1 and Company 2…
A:
Q: Consider the following set of points: {(-2 , -1) , (1 , 1) , (3 , 2)} a) Find the least square…
A: From the given information we find regression equation and graph.
Q: The regional transit authority for a major metropolitan area wants to determine whether there is any…
A: Note: " Since you have posted many sub-parts. we will solve the first three sub-parts for you. To…
Q: A ski resort asked a random sample of guests to rate their satisfaction on various attributes of…
A: Regression analysis estimates the relationship among variables. That is, it estimates the…
Q: Calculate for the coefficient b in the linear regression equation describing the sample data below…
A: From the given information, X Y 0.0721 0.3891 0.0966 0.4375 0.1238 0.4704 0.1661 0.5089…
Q: A random sample of twelve students were chosen, and their midterm test score (y), as- signment score…
A: Given, Midterm Score, y Assignment Score, x1 Classes Missed, x2 85 74 76 90 85 87 94 98…
Q: The following table gives the data for the average temperature and the snow accumulation in several…
A: Solution: Let x= Average Temperature (F) and y =Snow Accumulation x y x2 y2 xy 44 10 1936 100…
Q: A company trains its employees with instructional videos and claims that the amount of time, in…
A: It is given that sample size (n) is 5, the slope (b1) is 0.8 and SE of hours is 0.3464.
Q: 1. The table shows the rate of injury among young workers compared to the actual number of injury…
A: Given: X Y 1165711612110069980110401059586308962946010280…
Q: The following table shows the annual family income of the students enrolled in the JRMSU-TC and…
A: Solution-: Let, X=Annual family income (Pesos) (in '000) and Y=General weighted average (%) We have…
Q: below shows the numbers of newvehicle sales (in thousands) for Company 1 and Company 2 for 11 years.…
A:
Q: Examine each of the following scatter diagrams and the corresponding regression lines. Identify…
A: Given information- We have given two graphs of the corresponding regression line. Graph 1: Ŷ = 1.44X…
Q: Interpret the estimated regression coefficient corresponding to the Z variable. Data Salary…
A: Multiple linear regression model: A multiple linear regression model is given as y = b0 + b1x1 +…
Q: Find the equation of the regression line for the given data. -5 -3 4 -1 -2 3 11 -6 3 -4 -5 8. =…
A: The regression equation for one independent variable is, From the given information, Let X…
Q: Eight students are selected randomly, and their present graduate GPA is compared to thei…
A: For the given data has to find ( a) Regression equation ( b ) Hypothesis test for Regression
Q: The owner of Showtime Movie Theaters, Inc., used multiple regression analysis to predict gross…
A: We know that, Coefficient of determination=(correlation coefficient)2 Correlation coefficient is…
Q: A random sample of ten professional athletes produced the following data. The first row is the…
A:
Q: The monthly premium quoted by an insurance company for a critical illness policy was collected from…
A:
Q: A ski resort asked a random sample of guests to rate their satisfaction on various attributes of…
A: Since we only answer up to 3 sub-parts, we’ll answer the first 3. Please resubmit the question and…
Q: A rescarcher interested in explaining the level of foreign reserves for the country of Barbados…
A: Given information
Q: Find the equation of the regression line for the given data. Round values to the nearest thousandth.…
A:
Q: The following table shows, for a sample of towns in Great Britain, the number of solicitors, x, and…
A: As per our guidelines, we are allowed to answer first three sub-parts. Thanks Given Data : X Y…
Q: The table below shows the numbers of new-vehicle sales (in thousands) for Company 1 and Company 2…
A: The data shows the numbers of new-vehicle sales (in thousands) for Company 1 and Company 2 for 11…
Q: Refer to the Minitab display below, which is based on a sample of 54 bears. Identify the multiple…
A: The fitted regression equation is given as WEIGHT = - 253 - 0.85*HEADLEN + 0.64*LENGTH + 12.1*CHEST
Q: A researcher notes that, in a certain region, a disproportionate number of software millionaires…
A: a) In this case Total Births in Region (x) is the independent variable and Number of Software…
Q: A specialist in hospital administration stated that no. of employees in a hospital can be estimated…
A: Regression model: A regression model is required for the given data : The regression model can be…
Q: Suppose Tatiyana is interested in the relationship between language ability and time spent reading.…
A: Hello, Thanks for posting your question here. I believe the given regression equation is , y⏞ =…
Q: A seafood-sales manager collected data on the maximum daily temperature, T, and the daily revenue…
A:
Q: Use the given data to find the equation of the regression line. Round the final values to three…
A: Let x be the job performance, and y be the attitude. The sums are, Performance (x) Attitude(y) x2…
Q: The regional transit authority for a major metropolitan area wants to determine whetherthere is a…
A: Hey, since there are multiple subparts posted, we will answer first three subparts. If you want any…
Q: A study of the amount of rainfall and the quantity of air pollution removed produced the following…
A:
Q: The following table shows the number of cars sold last month by six dealers at Centreville Nissan…
A: The data shows the number of years of sales experience, and monthly car sales.
Q: A sample of 20 automobiles was taken, and the miles per gallon (MPG), horsepower, and total weight…
A: Given : A sample of 20 automobiles was taken, and the miles per gallon (MPG), horsepower, and total…
Q: Find the equation of the regression line for the given data. Round values to the nearest thousandth.…
A: The equation of the line is given by,
Q: A county real estate appraiser wants to develop a statistical model to predict the appraised value…
A: y^ = 91.80+19.72x slope = 19.72 x= no. of rooms y = appraise value (in thousands)
Q: Find the equation of the regression line for the following data set. y= 10 - 4 *456 y654
A: Formula: The equation of regression line is given by Y = a + bX, where a = ∑y∑x2-∑x∑xyn∑x2 - ∑x2, b…
Q: A study of the amount of rainfall and the quantity of air pollution removed produced the following…
A: Note, Since you have asked multiple question, we will solve the first question for you. If you want…
Q: The trip rate (y) and the corresponding household sizes (x) from a sample are shown in Table Q2.…
A: Simple linear regression model: A simple linear regression model is given as y^ = b0 + bx + e…
Q: Eight students are selected randomly, and their present graduate GPA is compared to their…
A: Introduction: Denote the response variable, Present GPA as y, and the explanatory variables, Undergr…
Q: A movie studio wishes to determine the relationship between the revenue from rental of comedies on…
A:
Q: A random sample of non-industrialized countries was selected, and the life expectancy in years is…
A: Men,x 59.7 72.9 41.9 46.2 50.3 43.2 Men,y 63.8 77.8 44.5 48.3 54 43.5
Q: The Wall Street Journal asked Concur Technologies, Inc., an expense management company, to examine…
A:

Step by step
Solved in 2 steps

- Olympic Pole Vault The graph in Figure 7 indicates that in recent years the winning Olympic men’s pole vault height has fallen below the value predicted by the regression line in Example 2. This might have occurred because when the pole vault was a new event there was much room for improvement in vaulters’ performances, whereas now even the best training can produce only incremental advances. Let’s see whether concentrating on more recent results gives a better predictor of future records. (a) Use the data in Table 2 (page 176) to complete the table of winning pole vault heights shown in the margin. (Note that we are using x=0 to correspond to the year 1972, where this restricted data set begins.) (b) Find the regression line for the data in part ‚(a). (c) Plot the data and the regression line on the same axes. Does the regression line seem to provide a good model for the data? (d) What does the regression line predict as the winning pole vault height for the 2012 Olympics? Compare this predicted value to the actual 2012 winning height of 5.97 m, as described on page 177. Has this new regression line provided a better prediction than the line in Example 2?Which of the following does not need to be computed to determine a simple regression line? SSx SP "Y-hat" SSyJensen Tire & Auto is deciding whether to purchase a maintenance contract for its newcomputer wheel alignment and balancing machine. Managers feel that maintenance expenseshould be related to usage, and they collected the following information on weeklyusage (hours) and annual maintenance expense (in hundreds of dollars). a. Develop a scatter chart with weekly usage hours as the independent variable. Whatdoes the scatter chart indicate about the relationship between weekly usage and annualmaintenance expense?b. Use the data to develop an estimated regression equation that could be used to predictthe annual maintenance expense for a given number of hours of weekly usage. Whatis the estimated regression model? c. Test whether each of the regression parameters b0 and b1 is equal to zero at a 0.05level of significance. What are the correct interpretations of the estimated regressionparameters? Are these interpretations reasonable?d. How much of the variation in the sample values of…
- A mail-order business selling personal computer supplies, software and hardware maintains a centralized warehouse. Management is currently examining the process of distribution from the warehouse and wants to study the factors that affect the warehouse distribution costs. Data collected over 24 random months contain the warehouse’s distribution cost (in thousands of Rands), the sales (in thousands of Rands) and the number of orders received. A multiple linear regression model was fitted to the data by using Stat1.2. Use the output to answer the questions that follow by typing only the letter of the correct option in the answer boxes. Variablesy: Warehouse Distribution Costx1: Salesx2: Number of Orders Model Fitting StatisticsR2 = 0.8504Adj R2: ? Regression Coefficients Beta Parameter Standard b Parameter Standard Estimates…Which of the multivariate regression parameters listed below would be best interpreted as: the predicted value on the dependent variable when all of the independent variables in the model are equal to zero. a b1 X1 R2Suppose the Sherwin-Williams Company is interested in developing a simple regression model with paint sales (Y) as the dependent variable and selling price (P) as the independent variable. Complete the following worksheet and then use it to determine the estimated regression line. Sales Region Selling Price Sales ($/Gallon) (x 1000 Gal) ii xixi yiyi xixiyiyi xi2xi2 yi2yi2 1 15 160 2,400 225 25,600 2 13.5 220 2,970 182.25 48,400 3 16.5 140 2,310 272.25 19,600 4 14.5 190 2,755 210.25 36,100 5 17 120 2,040 289 14,400 6 16 160 2,560 256 25,600 7 13 210 2,730 169 44,100 8 18 150 2,700 324 22,500 9 12 220 2,640 144 48,400 10 15.5 190 2,945 240.25 36,100 Total 151 1,760 26,050 2,312 320,800 Regression Parameters Estimations Slope (ββ) -16.49 Intercept (αα) 424.98 In words, for a dollar increase in the selling price, the expected sales will increase by 2,640 gallons in a given sales region.…
- Suppose the Sherwin-Williams Company is interested in developing a simple regression model with paint sales (Y) as the dependent variable and selling price (P) as the independent variable. Complete the following worksheet and then use it to determine the estimated regression line. Sales Region Selling Price Sales ($/Gallon) (x 1000 Gal) ii xixi yiyi xixiyiyi xi2xi2 yi2yi2 1 15 160 2,400 225 25,600 2 13.5 220 2,970 182.25 48,400 3 16.5 140 2,310 272.25 19,600 4 14.5 190 2,755 210.25 36,100 5 17 120 2,040 289 14,400 6 16 160 2,560 256 25,600 7 13 210 2,730 169 44,100 8 18 150 2,700 324 22,500 9 12 210 2,520 144 44,100 10 15.5 190 2,945 240.25 36,100 Total 151 1,750 2,312 What is the estimate of the standard deviation of the estimated slope (sbsb)? 2.627 3.173 2.877 Can you reject the hypothesis (at the 0.05 level of significance) that there is no relationship (i.e., β=0β=0) between the…The following table shows the length, in centimeters, of the humerus and the total wingspan, in centimeters, of several pterosaurs, which are extinct flying reptiles. (A graphing calculator is recommended.) (a) Find the equation of the least-squares regression line for the data. (Where × is the independent variable.) Round constants to the nearest hundredth. y= ? (b) Use the equation from part (a) to determine, to the nearest centimeter, the projected wingspan of a pterosaur if its humerus is 52 centimeters. ? cmUse the given data to find the equation of the regression line. Round the final values to three significant digits, if necessary. Managers rate employees according to job performance and attitude. The results for several randomly selected employees are given below. Performance Attitute59 7263 6765 7869 8258 7577 8776 9269 8370 8764 78 A. y=11.7+1.02x B. y=2.81+1.35x C. y=−47.3+2.02x D. y=92.3−0.669x
- Bluereef real estate agent wants to form a relationship between the prices of houses, how many bedrooms, House size in sq ft and Lot Size in sq ft.The data pertaining to 100 houses were processed using MINITAB and the following is an extract of the output obtained:The regression equation is Price = B + Bredroom + House Size + Alot SizePredictor Coef SE Coef T PConstant 37718 14177 2.66 **Bedrooms 2306 6994 0.33 0.742House Size 74.3 52.98 * 0.164Lot Size -4.36 17.02 -0.26 0.798 S= 25023 R-Sq=56.0% R-Sq(adj)=54.6% Source DF SS MS F PRegression 3 76501718347 25500572782 *** ****Residual Error 96…Bluereef real estate agent wants to form a relationship between the prices of houses, how many bedrooms, House size in sq ft and Lot Size in sq ft.The data pertaining to 100 houses were processed using MINITAB and the following is an extract of the output obtained:The regression equation is Price = B + Bredroom + House Size + Alot SizePredictor Coef SE Coef T PConstant 37718 14177 2.66 **Bedrooms 2306 6994 0.33 0.742House Size 74.3 52.98 * 0.164Lot Size -4.36 17.02 -0.26 0.798 S= 25023 R-Sq=56.0% R-Sq(adj)=54.6% Source DF SS MS F PRegression 3 76501718347 25500572782 *** ****Residual Error 96…Suppose that a kitchen cabinet warehouse company would like to be able to predict the area of a customer’s kitchen using the number of cabinets and the kitchen ceiling height. To do so data is collected on the following variables from a random sample of customers: Area – area of the kitchen in square feet Height – ceiling height in the kitchen (from floor to ceiling) in inches Cabinets – number of cabinets in the kitchen Suppose that a multiple linear regression model was fit to the data and that the following output resulted: Coefficients: (Intercept)HeightCabinets Estimate-57.98771.2760.3393 Std. Error8.63820.26430.1302 t value -6.7134.8282.607 Pr(>|t|)2.75e-074.44e-050.0145 What is the predicted area of a kitchen with a height of 96 inches and 10 cabinets? Report your answer to 1 decimal place. square feet

