An airline operates a call center to handle customer questions and complaints. The airline monitors a sample of calls to help ensure that the service being provided is of high quality. Ten random samples of 100 calls each were monitored under normal conditions. The center can be thought of as being in control when these 10 samples were taken. The number of calls in each sample not resulting in a satisfactory resolution for the customer is as follows. 5 3 2 3 3 4 6 4 6 (a) What is an estimate of the proportion of calls not resulting in a satisfactory outcome for the customer when the center is in control? 0.04 (b) Construct the upper and lower limits for a p chart for the manufacturing process, assuming each sample has 100 calls. (Round your answers to four decimal places.) UCL = 0.0988 LCL = 0.0188 (c) With the results of part (b), what conclusion should be made if a sample of 100 has 13 calls not resulting in a satisfactory resolution for the customer? Since p = the control limits, the process is out of control is outside of for the sample. (d) Compute the upper and lower limits for the np chart. (Round your answers to three decimal places.) UCL = LCL = (e) With the results of part (d), what conclusion should be made if a sample of 100 calls has 13 not resulting in a satisfactory conclusion for the customer? Since the number of calls not resulting in a satisfactory conclusion is outside of for the sample. the control limits, the process is out of control
An airline operates a call center to handle customer questions and complaints. The airline monitors a sample of calls to help ensure that the service being provided is of high quality. Ten random samples of 100 calls each were monitored under normal conditions. The center can be thought of as being in control when these 10 samples were taken. The number of calls in each sample not resulting in a satisfactory resolution for the customer is as follows. 5 3 2 3 3 4 6 4 6 (a) What is an estimate of the proportion of calls not resulting in a satisfactory outcome for the customer when the center is in control? 0.04 (b) Construct the upper and lower limits for a p chart for the manufacturing process, assuming each sample has 100 calls. (Round your answers to four decimal places.) UCL = 0.0988 LCL = 0.0188 (c) With the results of part (b), what conclusion should be made if a sample of 100 has 13 calls not resulting in a satisfactory resolution for the customer? Since p = the control limits, the process is out of control is outside of for the sample. (d) Compute the upper and lower limits for the np chart. (Round your answers to three decimal places.) UCL = LCL = (e) With the results of part (d), what conclusion should be made if a sample of 100 calls has 13 not resulting in a satisfactory conclusion for the customer? Since the number of calls not resulting in a satisfactory conclusion is outside of for the sample. the control limits, the process is out of control

Practical Management Science
6th Edition
ISBN:9781337406659
Author:WINSTON, Wayne L.
Publisher:WINSTON, Wayne L.
Chapter2: Introduction To Spreadsheet Modeling
Section: Chapter Questions
Problem 20P: Julie James is opening a lemonade stand. She believes the fixed cost per week of running the stand...

Related questions
Question
100%
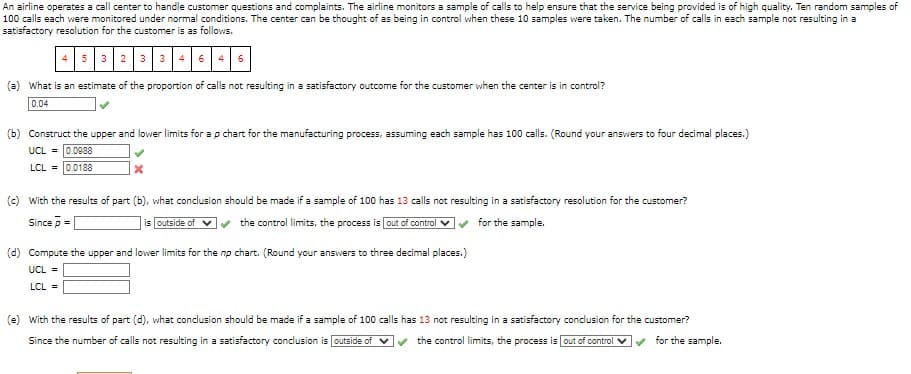
Transcribed Image Text:An airline operates a call center to handle customer questions and complaints. The airline monitors a sample of calls to help ensure that the service being provided is of high quality. Ten random samples of
100 calls each were monitored under normal conditions. The center can be thought of as being in control when these 10 samples were taken. The number of calls in each sample not resulting in a
satisfactory resolution for the customer is as follows.
(a) What is an estimate of the proportion of calls not resulting in a satisfactory outcome for the customer when the center is in control?
0.04
(b) Construct the upper and lower limits for a p chart for the manufacturing process, assuming each sample has 100 calls. (Round your answers to four decimal places.)
UCL = 0.0988
✓
X
LCL = 0.0188
(c) With the results of part (b), what conclusion should be made if a sample of 100 has 13 calls not resulting in a satisfactory resolution for the customer?
Since p =
is outside of ✔✔✔ the control limits, the process is out of control ✔✔✔ for the sample.
(d) Compute the upper and lower limits for the np chart. (Round your answers to three decimal places.)
UCL =
LCL =
(e) With the results of part (d), what conclusion should be made if a sample of 100 calls has 13 not resulting in a satisfactory conclusion for the customer?
Since the number of calls not resulting in a satisfactory conclusion is outside of the control limits, the process is out of control ✓ ✔for the sample.
Expert Solution
This question has been solved!
Explore an expertly crafted, step-by-step solution for a thorough understanding of key concepts.

This is a popular solution!

Trending now
This is a popular solution!

Step by step
Solved in 4 steps with 4 images

Recommended textbooks for you
Practical Management Science
Operations Management
ISBN:
9781337406659
Author:
WINSTON, Wayne L.
Publisher:
Cengage,

Operations Management
Operations Management
ISBN:
9781259667473
Author:
William J Stevenson
Publisher:
McGraw-Hill Education

Operations and Supply Chain Management (Mcgraw-hi…
Operations Management
ISBN:
9781259666100
Author:
F. Robert Jacobs, Richard B Chase
Publisher:
McGraw-Hill Education
Practical Management Science
Operations Management
ISBN:
9781337406659
Author:
WINSTON, Wayne L.
Publisher:
Cengage,
Operations Management
Operations Management
ISBN:
9781259667473
Author:
William J Stevenson
Publisher:
McGraw-Hill Education
Operations and Supply Chain Management (Mcgraw-hi…
Operations Management
ISBN:
9781259666100
Author:
F. Robert Jacobs, Richard B Chase
Publisher:
McGraw-Hill Education


Purchasing and Supply Chain Management
Operations Management
ISBN:
9781285869681
Author:
Robert M. Monczka, Robert B. Handfield, Larry C. Giunipero, James L. Patterson
Publisher:
Cengage Learning

Production and Operations Analysis, Seventh Editi…
Operations Management
ISBN:
9781478623069
Author:
Steven Nahmias, Tava Lennon Olsen
Publisher:
Waveland Press, Inc.