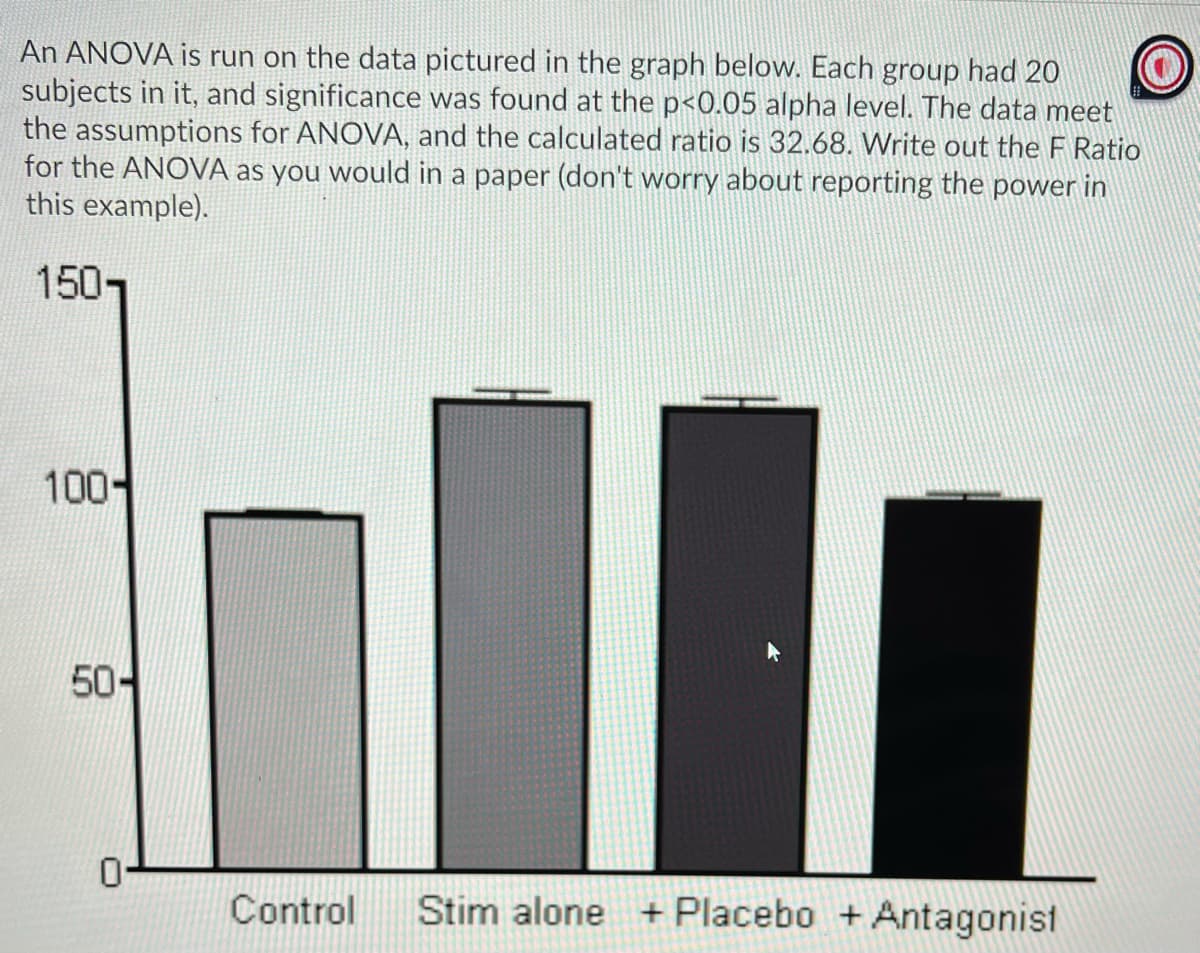
An ANOVA is run on the data pictured in the graph below. Each group had 20 subjects in it, and significance was found at the p<0.05 alpha level. The data meet the assumptions for ANOVA, and the calculated ratio is 32.68. Write out the F Ratio for the ANOVA as you would in a paper (don't worry about reporting the power in this example). 1507 100- 50- Control Stim alone + Placebo + Antagonist


Q: The probability that a person will die in the time interval (t, t2) is given by -}. p(t, < t s t2) =...
A:
Q: Find the Quartile Deviation and its Coefficient from the following data, relating to the weekly vage...
A:
Q: How are your grades? In a recent semester at a local university, 500 students enrolled in both Stati...
A: GivenTotal no. of students both Statistics I and Psychology I=500No. of students got A in statistics...
Q: Calculate mean deviation (from arithmetic mean) from the following values : 100.500 100.250 100.375 ...
A: The sum of the above items 1004.250 and the 1004.250 Mean = or 100.425 10
Q: Three coins are tossed. n(S)= Events: (a). the first coin shows a T n(a)- P(a)- (b). there are at mo...
A: given experiment: three coins are tossed.
Q: If {X(t)} is a random process with constant mean u and if XT T 1 | X(t) dt, then {X(t)} is mean-ergo...
A:
Q: researcher was interested in studying if there is a significant relationship between the severity of...
A: * SOLUTION :- Given that, (2)
Q: Find the p-value.
A: P-value is the probability of the null hypothesis being the correct hypothesis when the sample at ha...
Q: 2. R(T) is maximum at t= () i.e., \R(t)l < R(0)
A:
Q: Exercise 2 Many times property value appraisers estimate the value of specific properties with minor...
A: Given information: Apartment x1 x2 1 176 174 2 164 160 3 153 145 4 184 180 5 184 178 ...
Q: Question 5 A study found statistically significant results for a hypothesis tested with an independe...
A:
Q: A researcher conducts an independent-samples t test comparing two group means of 11.3 and 12.7. She ...
A: From the provided information,
Q: What percent of all the women weigh more than 180 pounds? (d) What percent of women that are 6 fe...
A: Given Information: The correlation between height and weight is r=0.45 Consider height as the indepe...
Q: How many ways can you arrange the letter from the words PLEASE?
A: How many ways can you arrange the letter from the words PLEASE?
Q: 1. R(t) is an even function of t
A:
Q: 11. Find out the likely production corresponding to a rainfall of 40 cms. from the following data: R...
A: Given The data is as follows: Rainfall (in cms.) Output (in quintals) Average 30 50 S.D 5 1...
Q: There are three Science books (Volume 1,2 and 3) and two Math books (Volume 1 and 2) how many ways c...
A:
Q: Estimate µ, from the following incomplete data : 1 3 4 13 21 37 State the necessary assumption made.
A:
Q: rete probability distribution: 1. The probability of each value of the random variable must be betwe...
A: 1. Given that X 1 5 7 8 P(X) 1/4=0.25 1/8=0.125 1/4=0.25 1/8=0.125 Here, 0<P(X=1)=0.25&l...
Q: Which of the following statement is true about the formula of permutation? A. 'n' is always greater ...
A: Given problems related to permutation and combination. We have to solve and select the correct choi...
Q: Calculate the mean and median from the following table : Class Intervals Frequency 6.5- 7.5 5 7.5- 8...
A:
Q: Q6 You have two machines. Machine 1 has a lifetime Tị which is exponentially distributed with parame...
A: Let X be a random variable having exponential distribution with parameter λ. The p.d.f of X is given...
Q: 6. Find the mean of the following series : Marks No. of Students Below 10 4 10-20 6. 20-30 10 30-40 ...
A: Solution is given in the attached picture:
Q: Find out the value of median from the following data : Daily wages (Rs) Number of Workers 10, 5, 7, ...
A: Solution:
Q: A university dean is interested in determining the proportion of students who receive some sort of s...
A: It is given that Sample size n = 250 Number of students receiving scholarship, X = 70 The critical v...
Q: The heights in cms of 30 persons are given below : 133 125 137 129 130 130 131 125 137 147 128 127 1...
A:
Q: NOTE. For positive integers a and b, you may assume that (а- 1)! (ь — 1)! (а +b—1)! za-1(1 – 2)*-1 d...
A: We are given the probability of getting dice 6 is θ & 1- θ for some other number ,where the rang...
Q: A researcher was interested in studying if there is a significant relationship between the severity ...
A: Given: O A B AB Total Critical 64 44 20 8 136 Severe 175 129 50 15 369 Moderate 211 528 ...
Q: Compute the geometric mean from the following data : 10, 110, 120, 50, 80, 60, 52, 37.
A:
Q: Assume that 5 students have the following ages: 17, 19, 22, 26, and 20. Assume that random samples o...
A: Given that the possible ages of students are 17, 19, 22, 26 and 20 Therefore, the elements in the po...
Q: 4. Evaluate: 18P3 5. Evaluate 12P4
A: We have to find following permutations, 18P3 = ? 12P4 = ?
Q: At one university, the mean distance commuted to campus by students is 16.0 miles, with a standard d...
A:
Q: Cost of health care: The following table presents the mean cost of a hospital stay, in $1000, and th...
A: Solution-: Let, X= Cost of hospital stay (in $1000) and Y=The number of hospital stay (in million...
Q: The average height of a large group of children is 43 inches, and the SD is 1.2 inches. The average ...
A: a) The relationship between correlation and regression is given as under Where r is the correlation...
Q: Determine whether you can use the normal distribution to approximate the binomial distribution. If y...
A: Given: p=34%=0.34n=12
Q: Compute the least-squares regression line for predicting the right foot temperature from the left fo...
A:
Q: Verify whether the sine wave process {X(t)}, where X(t) = Y cos@t, where Y is uniformly distributed ...
A:
Q: Mr. Roby is trying to estimate the difference in the proportion of his male students who on average ...
A: Random Condition In the given case both the sample, for male and female students, was obtained rando...
Q: Incomes 29109 21546 30417 10104 19279 27578 23581 26949 35423 12971 37895 31308 28256 31494 31552 34...
A: Any assumption about the parameter or probability function is known as hypothesis testing. For the g...
Q: Example 12. Find the standard deviation of the following series : Expenditure No. of students Below ...
A:
Q: A population of values has a normal distribution with μ=207.4 and σ=9.3. You intend to draw a random...
A: Given that, μ=207.4, σ=9.3, n = 239 The mean of the sampling distribution of sample mean is,
Q: 14. Show the following data by a pie diagram. Items of expenditure % of total expenditure Food 60 Cl...
A:
Q: Given the scores of Athena and Anthony in an entrance exam, who has a better performance? Compute fo...
A: Concentration of all the values around the central value of the given data is known as measures of ...
Q: 11. How many ways can you arrange the letters from the word QUALITY if all vowels be together? A. 65...
A: The number of possible arrange of data can be calculated using the principle counting methods. They ...
Q: Find seasonal variations by the ratio-to-trend method from the data given below: 1st Quarter Year 2n...
A:
Q: (a) the value of m (b) the marginal distribution (c) whether X and Y are independent.
A: Here given joint probability density function of x and y
Q: a. What is the probability that you receive a non-defective connector? b. You buy one of these compo...
A: Here define events and draw tree diagram Connector from supplier A = A Connector from supplier B = ...
Q: Students who have qualified for a scholarship include students from Fayetteville High School, from ...
A:
Q: Three sets are defined as follows: A = {x: 0 ≤ x ≤ 4} B = {x: 0 ≤ x ≤ 3} C = {x: −1 ≤ x ...
A:
Q: (a) Compute the least-square regression line for predicting the president's age from the first lady'...
A: Here independent variable is lady's age denoted by X and dependent variable is President's age denot...


Trending now
This is a popular solution!

Step by step
Solved in 2 steps with 2 images

- A veterinary nutritionist developed a diet for overweight dogs. The total volume of food consumed remains the same, but one-half of the dog food is replaced with a low-calorie “filler” such as canned green beans. Six overweight dogs were randomly selected from her practice and were put on this program. Their initial weights were recorded, and they were weighed again after 4 weeks. The results of the experiment are shown below. At α=0.05, can it be concluded that the dogs significantly lost weight?The average effect size in social psychology is around d = 0.21. Conventionally, a sample over 30individuals is considered 'large.' If we are running an experiment for which we will perform atwo-tailed test t-test and we have 30 individuals in each of the two conditions, what is ourpredicted power? (use the standard alpha)A sample of 12 radon detectors of a certain type was selected, and each was exposed to 100 pCi/L of radon. The resulting readings were as follows: 105.6 90.9 91.2 96.9 96.5 91.3 100.1 105.5 99.6 107.7 103.3 92.4 Does this data suggest that the population mean reading under these conditions differ from 100? (a) State the null and alternative hypotheses. (b) Calculate, correct to 2 decimal places, (i) the sample mean, x ; and (ii) the sample standard deviation, s. (c) Evaluate the appropriate test statistic. (d) Test these hypotheses at 0.05 level of significance.
- Q1. An anthropologist wants to collect data to determine whether the two different cultural groups that occupy an isolated Pacific Island grow to be different heights. The results of his samples of the heights of adult females are as follows Do these samples constitute enough evidence to reject the null hypothesis that the heights of the two groups the same? Set alpha to .05.Researchers interested in lead exposure due to car exhaust sampled the blood of 52 police officers subjected to constant inhalation of automobile exhaust fumes while working traffic enforcement in a primarily urban environment. The blood samples of these officers had an average lead concentration of 124.32 µg/l and a SD of 37.74 µg/l; a previous study of individuals from a nearby suburb, with no history of exposure, found an average blood level concentration of 35 µg/l. Based on your preceding result, without performing a calculation, would a 99% confidence interval for the average blood concentration level of police officers contain 35 µg/l? Based on your preceding result, without performing a calculation, would a 99% confidence interval for this difference contain 0? Explain why or why not.A sample of 12 radon detectors of a certain type was selected, and each was exposed to 100 pCi/L of radon. The resulting readings were as follows: 104.3 89.6 89.9 95.6 95.2 90.0 98.8 103.7 98.3 106.4 102.0 91.1 a)Does this data suggest that the population mean reading under these conditions differs from 100? State and test the appropriate hypotheses using =.05. b) Suppose that prior to the experiment, a value of teta=7.5 had been assumed. How many determinations would then have been appropriate to obtain beta=.10 for the alternative u=95 ?
- Arsenic-based additives in chicken feed have been banned by the European Union. Ifa restaurant chain finds significant evidence that the mean arsenic level of theirchickens is above 80 ppb (parts per billion), the chain will stop using that supplier ofchicken meat. The hypotheses are: H 0 : µ = 80H 1 : µ > 80 where µ represents the mean arsenic level in all chicken meat from that supplier.Samples from two different suppliers are analyzed, and the resulting p-values aregiven: Sample from Supplier A: p-value is 0.0003Sample from Supplier B: p-value is 0.3500 a) Interpret each p-value in terms of the probability of the results happening byrandom chance. b) Which p-value shows stronger evidence for the alternative hypothesis? c) Which supplier, A or B, should the chain get chickens from in order to avoid toohigh a level of arsenic?1. A researcher reports an F-ratio with df(between) = 3 and df(within) = 28. How many treatment conditions were compared in the experiment? If samples have an equal number of participants, how many are in each treatment? 2. A researcher obtains an F = 4.10 with df = 2, 14. Is this value sufficient to reject the null with α = .05? Is it sufficient enough to reject the null with α = .01?A sample of patients is tested to determine if they have any hospital borne infections. How large of a sample must be collected to be accurate within 0.01 at the 1% level of significance, if the hospital estimates the true proportion of patients infected is 0.045? p̂ = q̂ = E = Z= n=