An article about the California lottery gave the following information on the age distribution of adults in California: 35% are between 18 and 34 years old, 51% are between 35 and 64 years old, and 14% are 65 years old or older. The article also gave information on the age distribution of those who purchase lottery tickets. The following table is consistent with the values given in the article. Suppose that the data resulted from a random sample of 200 lottery ticket purchasers. Based on these sample data, is it reasonable to conclude that one or more of these three age groups buys a disproportionate share of lottery tickets? Use a chi-square goodness-of-fit test with a = 0.05. Age of Purchaser 18-34 35-64 65 and over Frequency 41 118 41 Calculate the test statistic. (Round your answer to two decimal places.) x²= = Use technology to calculate the P-value. (Round your answer to four decimal places.) P-value = What can you conclude? The data ---Select--- ✓strong evidence to conclude that one or more of the three age groups buys a disproportionate share of lottery tickets.
An article about the California lottery gave the following information on the age distribution of adults in California: 35% are between 18 and 34 years old, 51% are between 35 and 64 years old, and 14% are 65 years old or older. The article also gave information on the age distribution of those who purchase lottery tickets. The following table is consistent with the values given in the article. Suppose that the data resulted from a random sample of 200 lottery ticket purchasers. Based on these sample data, is it reasonable to conclude that one or more of these three age groups buys a disproportionate share of lottery tickets? Use a chi-square goodness-of-fit test with a = 0.05. Age of Purchaser 18-34 35-64 65 and over Frequency 41 118 41 Calculate the test statistic. (Round your answer to two decimal places.) x²= = Use technology to calculate the P-value. (Round your answer to four decimal places.) P-value = What can you conclude? The data ---Select--- ✓strong evidence to conclude that one or more of the three age groups buys a disproportionate share of lottery tickets.

Glencoe Algebra 1, Student Edition, 9780079039897, 0079039898, 2018
18th Edition
ISBN:9780079039897
Author:Carter
Publisher:Carter
Chapter10: Statistics
Section10.4: Distributions Of Data
Problem 19PFA

Related questions
Question
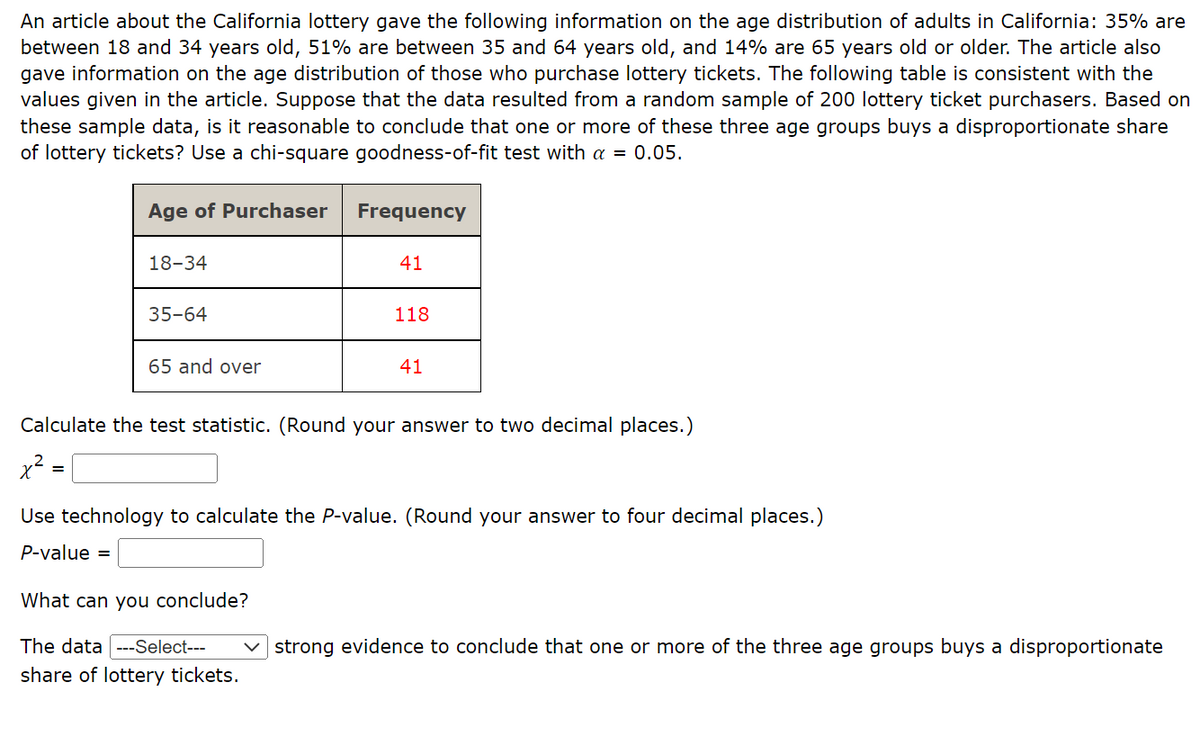
Transcribed Image Text:An article about the California lottery gave the following information on the age distribution of adults in California: 35% are
between 18 and 34 years old, 51% are between 35 and 64 years old, and 14% are 65 years old or older. The article also
gave information on the age distribution of those who purchase lottery tickets. The following table is consistent with the
values given in the article. Suppose that the data resulted from a random sample of 200 lottery ticket purchasers. Based on
these sample data, is it reasonable to conclude that one or more of these three age groups buys a disproportionate share
of lottery tickets? Use a chi-square goodness-of-fit test with a = 0.05.
Age of Purchaser
18-34
35-64
65 and over
Frequency
41
What can you conclude?
The data ---Select--- V
share of lottery tickets.
118
41
Calculate the test statistic. (Round your answer to two decimal places.)
x² =
Use technology to calculate the P-value. (Round your answer to four decimal places.)
P-value =
strong evidence to conclude that one or more of the three age groups buys a disproportionate
Expert Solution
This question has been solved!
Explore an expertly crafted, step-by-step solution for a thorough understanding of key concepts.

This is a popular solution!

Trending now
This is a popular solution!

Step by step
Solved in 3 steps with 3 images

Recommended textbooks for you
Glencoe Algebra 1, Student Edition, 9780079039897…
Algebra
ISBN:
9780079039897
Author:
Carter
Publisher:
McGraw Hill

Holt Mcdougal Larson Pre-algebra: Student Edition…
Algebra
ISBN:
9780547587776
Author:
HOLT MCDOUGAL
Publisher:
HOLT MCDOUGAL
Glencoe Algebra 1, Student Edition, 9780079039897…
Algebra
ISBN:
9780079039897
Author:
Carter
Publisher:
McGraw Hill
Holt Mcdougal Larson Pre-algebra: Student Edition…
Algebra
ISBN:
9780547587776
Author:
HOLT MCDOUGAL
Publisher:
HOLT MCDOUGAL