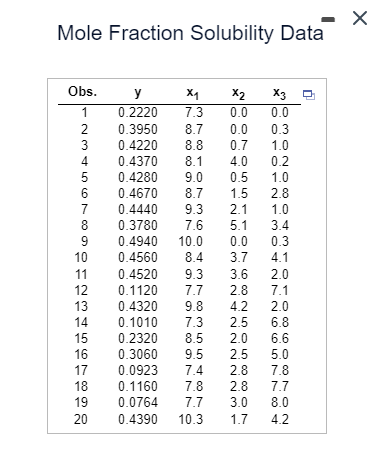
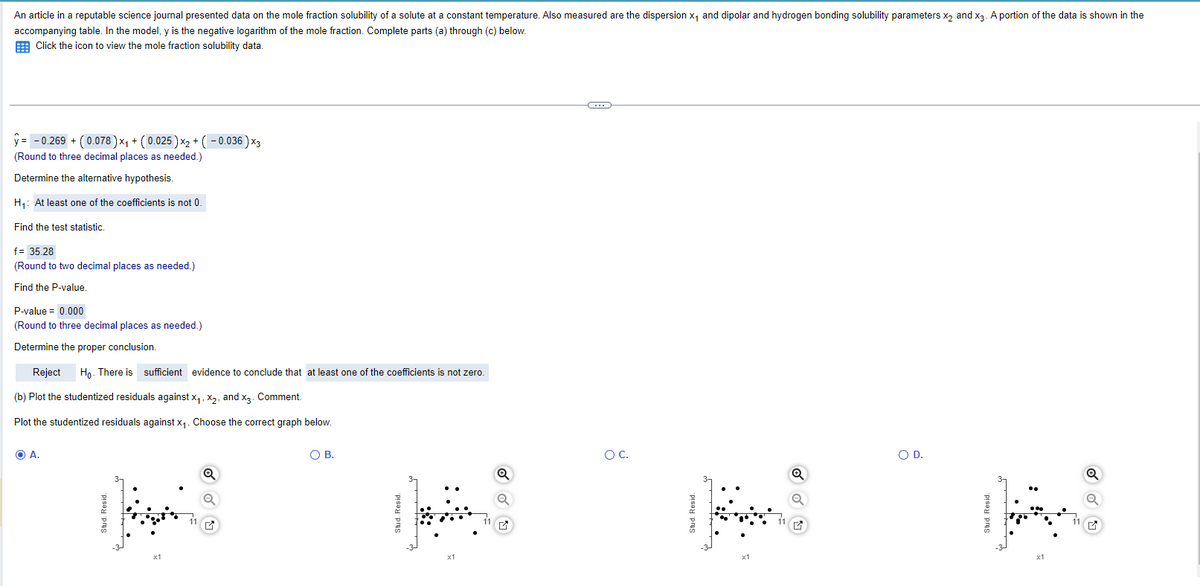
Mole Fraction Solubility Data Obs. y x1 x2 X3 1 0.2220 7.3 0.0 0.0 23456 0.3950 8.7 0.0 0.3 0.4220 8.8 0.7 1.0 0.4370 8.1 4.0 0.2 5 0.4280 9.0 0.5 1.0 6 0.4670 8.7 1.5 2.8 7 0.4440 9.3 2.1 1.0 8 0.3780 7.6 5.1 3.4 9 0.4940 10.0 0.0 0.3 10 0.4560 8.4 3.7 4.1 11 0.4520 9.3 3.6 2.0 12 0.1120 7.7 2.8 7.1 13 0.4320 9.8 4.2 2.0 14 0.1010 7.3 2.5 6.8 15 0.2320 8.5 2.0 6.6 16 0.3060 9.5 2.5 5.0 17 0.0923 7.4 2.8 7.8 18 0.1160 7.8 2.8 7.7 222 19 0.0764 7.7 3.0 8.0 20 0.4390 10.3 1.7 4.2 An article in a reputable science journal presented data on the mole fraction solubility of a solute at a constant temperature. Also measured are the dispersion x₁ and dipolar and hydrogen bonding solubility parameters x2 and x3. A portion of the data is shown in the accompanying table. In the model, y is the negative logarithm of the mole fraction. Complete parts (a) through (c) below. Click the icon to view the mole fraction solubility data. y= -0.269 + (0.078) ×₁ + (0.025) x2 + (-0.036) ×3 (Round to three decimal places as needed.) Determine the alternative hypothesis. H₁: At least one of the coefficients is not 0. Find the test statistic. f= 35.28 (Round to two decimal places as needed.) Find the P-value. P-value = 0.000 (Round to three decimal places as needed.) Determine the proper conclusion. Reject Ho. There is sufficient evidence to conclude that at least one of the coefficients is not zero. (b) Plot the studentized residuals against x₁, x2, and x3. Comment. Plot the studentized residuals against x₁. Choose the correct graph below. A. Stud. Resid. ○ B. Stud. Resid. x1 ☑ ○ C. Stud. Resid. x1 ○ D. Q Stud. Resid. 11 ☑
Mole Fraction Solubility Data Obs. y x1 x2 X3 1 0.2220 7.3 0.0 0.0 23456 0.3950 8.7 0.0 0.3 0.4220 8.8 0.7 1.0 0.4370 8.1 4.0 0.2 5 0.4280 9.0 0.5 1.0 6 0.4670 8.7 1.5 2.8 7 0.4440 9.3 2.1 1.0 8 0.3780 7.6 5.1 3.4 9 0.4940 10.0 0.0 0.3 10 0.4560 8.4 3.7 4.1 11 0.4520 9.3 3.6 2.0 12 0.1120 7.7 2.8 7.1 13 0.4320 9.8 4.2 2.0 14 0.1010 7.3 2.5 6.8 15 0.2320 8.5 2.0 6.6 16 0.3060 9.5 2.5 5.0 17 0.0923 7.4 2.8 7.8 18 0.1160 7.8 2.8 7.7 222 19 0.0764 7.7 3.0 8.0 20 0.4390 10.3 1.7 4.2 An article in a reputable science journal presented data on the mole fraction solubility of a solute at a constant temperature. Also measured are the dispersion x₁ and dipolar and hydrogen bonding solubility parameters x2 and x3. A portion of the data is shown in the accompanying table. In the model, y is the negative logarithm of the mole fraction. Complete parts (a) through (c) below. Click the icon to view the mole fraction solubility data. y= -0.269 + (0.078) ×₁ + (0.025) x2 + (-0.036) ×3 (Round to three decimal places as needed.) Determine the alternative hypothesis. H₁: At least one of the coefficients is not 0. Find the test statistic. f= 35.28 (Round to two decimal places as needed.) Find the P-value. P-value = 0.000 (Round to three decimal places as needed.) Determine the proper conclusion. Reject Ho. There is sufficient evidence to conclude that at least one of the coefficients is not zero. (b) Plot the studentized residuals against x₁, x2, and x3. Comment. Plot the studentized residuals against x₁. Choose the correct graph below. A. Stud. Resid. ○ B. Stud. Resid. x1 ☑ ○ C. Stud. Resid. x1 ○ D. Q Stud. Resid. 11 ☑

College Algebra (MindTap Course List)
12th Edition
ISBN:9781305652231
Author:R. David Gustafson, Jeff Hughes
Publisher:R. David Gustafson, Jeff Hughes
Chapter5: Exponential And Logarithmic Functions
Section5.2: Applications Of Exponential Functions
Problem 50E
Question
100%
I need help with part b, to plot the studentized residuals against x1,x2,and x3.
Choose the correct graph
Transcribed Image Text:Mole Fraction Solubility Data
Obs.
y
x1
x2
X3
1
0.2220
7.3
0.0
0.0
23456
0.3950
8.7
0.0
0.3
0.4220 8.8
0.7
1.0
0.4370
8.1
4.0
0.2
5
0.4280
9.0
0.5
1.0
6
0.4670
8.7
1.5
2.8
7
0.4440
9.3
2.1
1.0
8
0.3780
7.6
5.1
3.4
9
0.4940
10.0
0.0
0.3
10
0.4560
8.4
3.7
4.1
11
0.4520
9.3
3.6
2.0
12
0.1120
7.7
2.8 7.1
13
0.4320
9.8
4.2 2.0
14
0.1010
7.3
2.5
6.8
15
0.2320
8.5
2.0 6.6
16
0.3060
9.5
2.5
5.0
17
0.0923
7.4
2.8
7.8
18
0.1160
7.8
2.8
7.7
222
19
0.0764 7.7
3.0
8.0
20 0.4390 10.3
1.7
4.2
Transcribed Image Text:An article in a reputable science journal presented data on the mole fraction solubility of a solute at a constant temperature. Also measured are the dispersion x₁ and dipolar and hydrogen bonding solubility parameters x2 and x3. A portion of the data is shown in the
accompanying table. In the model, y is the negative logarithm of the mole fraction. Complete parts (a) through (c) below.
Click the icon to view the mole fraction solubility data.
y= -0.269 + (0.078) ×₁ + (0.025) x2 + (-0.036) ×3
(Round to three decimal places as needed.)
Determine the alternative hypothesis.
H₁: At least one of the coefficients is not 0.
Find the test statistic.
f= 35.28
(Round to two decimal places as needed.)
Find the P-value.
P-value = 0.000
(Round to three decimal places as needed.)
Determine the proper conclusion.
Reject
Ho. There is sufficient evidence to conclude that at least one of the coefficients is not zero.
(b) Plot the studentized residuals against x₁, x2, and x3. Comment.
Plot the studentized residuals against x₁. Choose the correct graph below.
A.
Stud. Resid.
○ B.
Stud. Resid.
x1
☑
○ C.
Stud. Resid.
x1
○ D.
Q
Stud. Resid.
11
☑
Expert Solution
This question has been solved!
Explore an expertly crafted, step-by-step solution for a thorough understanding of key concepts.

Step by step
Solved in 2 steps with 3 images

Recommended textbooks for you
College Algebra (MindTap Course List)
Algebra
ISBN:
9781305652231
Author:
R. David Gustafson, Jeff Hughes
Publisher:
Cengage Learning


Algebra & Trigonometry with Analytic Geometry
Algebra
ISBN:
9781133382119
Author:
Swokowski
Publisher:
Cengage
College Algebra (MindTap Course List)
Algebra
ISBN:
9781305652231
Author:
R. David Gustafson, Jeff Hughes
Publisher:
Cengage Learning
Algebra & Trigonometry with Analytic Geometry
Algebra
ISBN:
9781133382119
Author:
Swokowski
Publisher:
Cengage

Algebra and Trigonometry (MindTap Course List)
Algebra
ISBN:
9781305071742
Author:
James Stewart, Lothar Redlin, Saleem Watson
Publisher:
Cengage Learning

College Algebra
Algebra
ISBN:
9781305115545
Author:
James Stewart, Lothar Redlin, Saleem Watson
Publisher:
Cengage Learning