An article in the Journal of Sound and Vibration (Vol. 151, 1991, pp. 383-394) described a study investigating the relationship between noise exposure and hypertension. The following data are representative of those reported in the article. у х у х 1 60 5 85 O 63 4 89 1 65 6 90 2 70 8 9O 5 70 4 9O 1 70 5 9O 4 80 7 94 6 90 9 100 2 80 7 100 3 80 6 100 Fit a linear regression model relating blood pressure rise in millimeters of mercury (y) to sound pressure level in decibels (x) using least squares.
An article in the Journal of Sound and Vibration (Vol. 151, 1991, pp. 383-394) described a study investigating the relationship between noise exposure and hypertension. The following data are representative of those reported in the article. у х у х 1 60 5 85 O 63 4 89 1 65 6 90 2 70 8 9O 5 70 4 9O 1 70 5 9O 4 80 7 94 6 90 9 100 2 80 7 100 3 80 6 100 Fit a linear regression model relating blood pressure rise in millimeters of mercury (y) to sound pressure level in decibels (x) using least squares.

Elementary Linear Algebra (MindTap Course List)
8th Edition
ISBN:9781305658004
Author:Ron Larson
Publisher:Ron Larson
Chapter5: Inner Product Spaces
Section5.4: Mathematical Models And Least Squares Analysis
Problem 39E

Related questions
Question
1
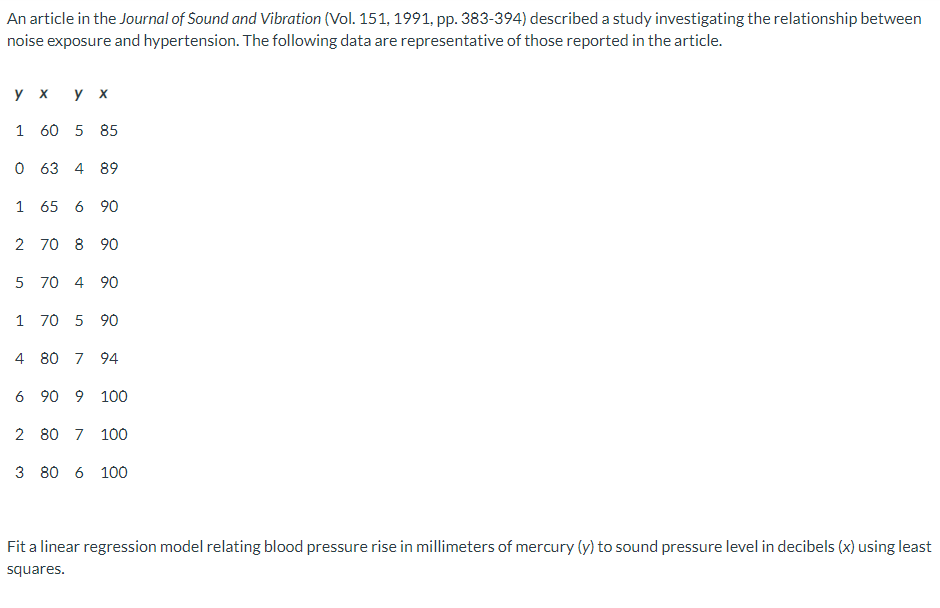
Transcribed Image Text:An article in the Journal of Sound and Vibration (Vol. 151, 1991, pp. 383-394) described a study investigating the relationship between
noise exposure and hypertension. The following data are representative of those reported in the article.
у х
у х
1 60 5 85
O 63 4 89
1 65 6 90
2 70 8 9O
5 70 4 9O
1 70 5 9O
4 80 7 94
6 90 9 100
2 80 7 100
3 80 6 100
Fit a linear regression model relating blood pressure rise in millimeters of mercury (y) to sound pressure level in decibels (x) using least
squares.
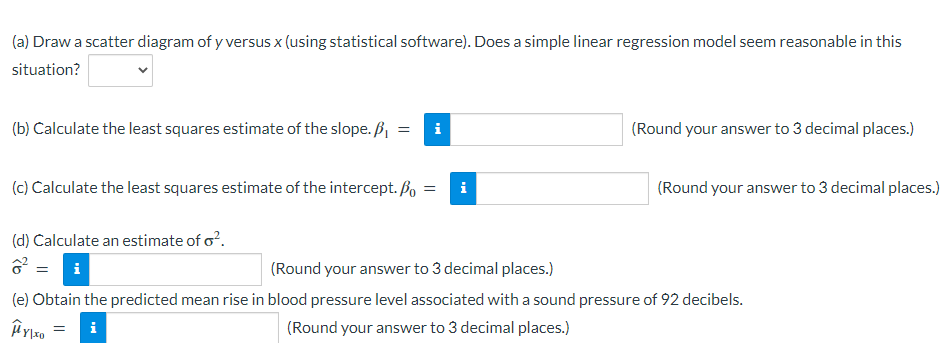
Transcribed Image Text:(a) Draw a scatter diagram of y versus x (using statistical software). Does a simple linear regression model seem reasonable in this
situation?
(b) Calculate the least squares estimate of the slope. B, =
i
(Round your answer to 3 decimal places.)
(c) Calculate the least squares estimate of the intercept. Bo =i
(Round your answer to 3 decimal places.)
(d) Calculate an estimate of o?.
i
(Round your answer to 3 decimal places.)
(e) Obtain the predicted mean rise in blood pressure level associated with a sound pressure of 92 decibels.
i
(Round your answer to 3 decimal places.)
Expert Solution
This question has been solved!
Explore an expertly crafted, step-by-step solution for a thorough understanding of key concepts.

Step by step
Solved in 3 steps with 3 images

Recommended textbooks for you
Elementary Linear Algebra (MindTap Course List)
Algebra
ISBN:
9781305658004
Author:
Ron Larson
Publisher:
Cengage Learning

Elementary Linear Algebra (MindTap Course List)
Algebra
ISBN:
9781305658004
Author:
Ron Larson
Publisher:
Cengage Learning