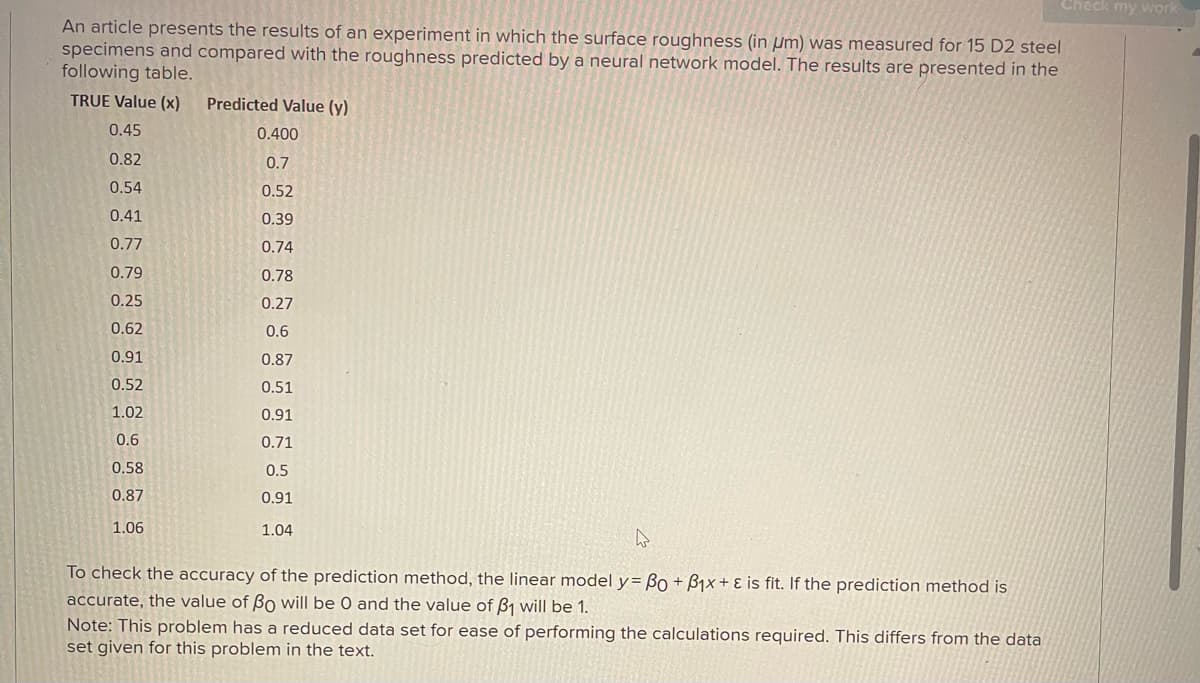
An article presents the results of an experiment in which the surface roughness (in μm) was measured for 15 D2 steel specimens and compared with the roughness predicted by a neural network model. The results are presented in the following table. TRUE Value (x) Predicted Value (y) 0.45 0.400 0.82 0.7 0.54 0.52 0.41 $0.39 0.77 0.74 0.79 0.78 0.25 0.27 0.62 0.6 0.91 0.87 0.52 0.51 1.02 0.91 0.6 0.71 0.58 0.5 0.87 0.91 1.06 1.04


Q: Storm damage can occur to homes in any given year, with the amount of damage varying randomly from…
A: According to the given information,Let X represent the dollar value of storm damage in a given…
Q: Weights of women in one age group are normally distributed with a standard deviation of 18 lb. A…
A: The given data is as follows:Population standard deviation, Confidence level, Margin of Error,
Q: Given the following Data Set for a Sample, build a 83% Cl=(a, b) for the Average. X=[3.2, 3.7, 1.9,…
A: The objective of this question is to calculate the 83% confidence interval for the average of the…
Q: Using the output below, predict the amount of monthly sales if monthly advertising expenses is…
A: From the given information, it is clear thatThe value of intercept(b0) is 759.57The value of…
Q: Given the distribution below, what is EX? x P(X=x) -30 0.22 1 0.54 11 0.01 42 0.11…
A: The expected value calculated by the formula…
Q: & 6.2 K Question 14 of 17 This quiz: 17 point(s) possible This question: 1 point(s) possible Submit…
A: Choosing the Correct Answer:The correct answer is B. It is possible because the margin of error is…
Q: Find the mean
A:
Q: continue the question
A: Given that the portfolio is homogeneous with an average number of claims per year of 75, the mean,…
Q: Consider the following time series data. Week 1 2 3 4 5 6 Value 18 11 14 10 16 13 (a) Construct a…
A: The question is about forecasting.Given :
Q: A genetic experiment with peas resulted in one sample of offspring that consisted of 442 green peas…
A: The question is about confidence interval.Given :Total no. of green peas ( y ) = 442Total no. of…
Q: Study The following data was obtained on a study regarding low carb diet and a high protein diet.…
A: The sample mean and sample standard deviation for low carb and high protein are given.Want to…
Q: X 5, USA Today reported that approximately 25% of all state prison inmates released on parole become…
A: 5) Let x = number of prisoners out of five on parole who become repeat offenders.The probability…
Q: Can some one clarify me when to use binomial distribution and when to use binomial approximation…
A: The objective of the question is to understand when to use binomial distribution and when to use…
Q: A manufacturer knows that their items have a normally distributed length, with a mean of 17 inches,…
A: The objective of this question is to find the probability that a randomly chosen item from a…
Q: Let T ∼ Γ (4, 0.7). Find P(T ≤ 1). (Round the final answer to four decimal places.)
A: The random variable i.e. T follows the gamma distribution with
Q: A normal distribution has a mean of 150 and a standard deviation of 8. Find the z-score for a data…
A: The objective of this question is to find the z-score for a data value of 151 in a normal…
Q: The CSV file modeldata.csv contains 200 observations of 4 explanatory variables (x1, x2, x3, x4) and…
A: A residual plot is given, where the fitted y values are on the x axis, and the standardised…
Q: Giving a test to a group of students, the grades and genders are summarized below. A B C Total Male…
A: It is required to find the probability that a randomly chosen student was male OR received grade…
Q: Problem #1: A sample of 20 vehicles is outfitted with snow tires. The vehicles travel 85 km/h in…
A: It is required to test whether the true mean stopping distance differs from 151 meters.The sample…
Q: On average do the number of people visiting Universal Studios and Disney World differ? It is known…
A: The objective of this question is to calculate the upper bound for a 95% confidence interval (CI)…
Q: Question 3 a) Grace Floral Shop sells several types of roses for all occasions. It is known that 43%…
A: answer with explanation is given below:Explanation:i) The parameter of the distribution is the…
Q: 34. What is the number of distinguishable arrangements in the letters in the word SMITH?
A: As per our guidelines we are supposed to answer only one question Kindly post the remaining…
Q: The mayor of a town has proposed a plan for the annexation of a new community. A political study…
A: The objective of this question is to determine whether there is enough evidence to support the claim…
Q: News articles that link to related stories are widely used in Web marketing. With a large number of…
A: Below is the clarified and detailed explanation for above tricky question ....if you are ok with my…
Q: S₁ =.60 Decision A 4 Decision B Decision C N 3 S₁8 S₁ 10 S2 2 SL What is the Expected Value with…
A: The given decision tree is given in terms of tabulated format as follows:Decision S1S2Decision…
Q: The life of automobile voltage regulators has an exponential distribution with a mean life of six…
A: To solve this problem, we can use the properties of the exponential distribution.Given:The voltage…
Q: How would you solve this question?
A: The mean height of trees in the first field is smaller than the second field.Explanation:
Q: You intend to draw a random sample of size �=542 from a population whose parameter is p = 0.42…
A:
Q: Source Value Std_Err t P_value Intercept 101994.90 5224.233 19.523 <0.0001 Female -24711.92 7127.380…
A: The given regression results are as…
Q: All Bookma A meteorologist measures the atmospheric pressure P (in kilograms per square meter) at…
A: A regression is a technique in statistics that relates a dependent and independent variable. In this…
Q: Company XYZ know that replacement times for the DVD players it produces are normally distributed…
A: The objective of the question is to find the probability that a randomly selected DVD player will…
Q: A set of exam scores is normally distributed and has a mean of 76.4 and a standard deviation of 9.5.…
A: From the provided information,
Q: The following graph illustrates 140 120 100 10 20 40 50 60 70 80 X
A: You are given a scatter plot of data on X and Y. You just need to select the appropriate…
Q: How much noisier are streets where cars travel faster? An article reports noise levels in decibels…
A: The data set of speed and noise…
Q: The CSV file modeldata.csv contains 200 observations of 4 explanatory variables (x1, x2, x3, x4) and…
A: Given the Cook's statistic graph as
Q: Find the following z values for the standard normal variable Z. (You may find it useful to reference…
A: Since you have posted a question with multiple sub parts, we will provide the solution only to the…
Q: A grocery store's receipts show that Sunday customer purchases have a skewed distribution with a…
A: The question is about sampling distribution.Given :Population mean purchases ( ) = $32Population…
Q: A researcher wonders whether younger mothers have babies that are significantly heavier or lighter…
A: Suppose is the population mean weight of babies of younger mother.It is needed to test whether the…
Q: Not apart of assignment, practice work
A: FINAL ANSWER a) Mean = 0.0095 Variance = 1.0083∗10(−5) or 0.000010089 b) P[X<0.0095]=0.5 c)…
Q: A binomial experiment with probability of success p=0.79 and n = 6 trials is conducted. What is the…
A: Given,Probability of success, p = 0.79Number of trials, n = 6We need to calculate the probability…
Q: Question 8.7.1)The coefficient of variation of a frequency distribution is 76% and the mean of…
A:
Q: A maintenance person has the job of keeping two machines in working order. The amount of time that a…
A: In the question, given that, Machine works before breaking down has an exponential distribution with…
Q: i.i.d Assume X1,..., Xn N(μ, 1). To test Hoμ 0, the size a test rejects when χ- μο Z= > Za σ√√n…
A:
Q: A jar contains 6 red marbles, numbered 1 to 6, and 12 blue marbles numbered 1 to 12. a) A marble is…
A: Probability quantifies the chances of happening an event. The probability values always lie in the…
Q: What is the average household income in the United States and how does it vary by demographic…
A: Define Average Household Income:Average household income refers to the total income earned by all…
Q: how to get the answer using ti-83plus calculator
A: To calculate the probability of an event using a TI-83 Plus calculator, one must input the relevant…
Q: Fit a regression line to the data shown in the chart, and find the coefficient of correlation for…
A:
Q: A factory produces a particular electrical component. On average, the probability that a component…
A: The objective of this question is to find the probability of having at least one faulty component in…
Q: The graph illustrates a normal distribution for the prices paid for a particular model of HD…
A: The approximate percentages are:1) Between $1505 and $1600: 34.13%2) More than $1885: 0.13%3)…
Q: A triangle has vertices (1, 6), (3, 0) and (-3, -7). Its area in square units is? 1. 10 2. 25 3. 30…
A: To find the area of a triangle with given vertices, we can use the formula for the area of a…

Step by step
Solved in 3 steps with 4 images

- If the Cumulative Gain at a depth of 15% for the Neural Network model is converted to number of primary/positive event cases, what will be the number of cases? Show your calculation.Omega-3, finis Exercises 21 and 23 describe an experi-ment investigating the effectiveness of omega-3 fats in treating bipolar disorder. Suppose some of the 30 sub-jects were very active people who walked a lot or got vig-orous exercise several times a week, while others tended to be more sedentary, working office jobs and watchinga lot of TV. Why might researchers choose to block thesubjects by activity level before randomly assigning themto the omega-3 and placebo groups?Infants, even newborns, prefer to look at attractive faces compared to less attractive faces (Slater, et al., 1998). In the study, infants from 1 to 6 days old were shown two photographs of women’s faces. Previously, a group of adults had rated one of the faces as significantly more attractive than the other. The babies were positioned in front of a screen on which the photographs were presented. The pair of faces remained on the screen until the baby accumulated a total of 20 seconds of looking at one or the other. The number of seconds looking at the attractive face was recorded for each infant. Suppose that the study used a sample of n = 9 infants and the data produced an average of M = 13 for the attractive face with an estimated standard error sM= 1 (SS = 72). If there were no preference, the 20 seconds should be divided equally between the two photographs. Note that all the available information comes from the sample. Specifically, we do not know the population mean or the…
- Infants, even newborns, prefer to look at attractive faces compared to less attractive faces (Slater, et al., 1998). In the study, infants from 1 to 6 days old were shown two photographs of women’s faces. Previously, a group of adults had rated one of the faces as significantly more attractive than the other. The babies were positioned in front of a screen on which the photographs were presented. The pair of faces remained on the screen until the baby accumulated a total of 20 seconds of looking at one or the other. The number of seconds looking at the attractive face was recorded for each infant. Suppose that the study used a sample of n = 9 infants and the data produced an average of M = 13 for the attractive face with an estimated standard error sM= 1 (SS = 72). If there were no preference, the 20 seconds should be divided equally between the two photographs. Note that all the available information comes from the sample. Specifically, we do not know the population mean or the…Dyslexia refers to a specific reading disability that affects 10% to 15% of the general population. A dyslexic child is defined as a child of normal or above-normal intelligence with no known organic behavioural disorders who, despite normal schooling, shows a reading lag of at least two years. A researcher proposed that dyslexia was the result of a complex visual deficit that could be immediately corrected by simply putting a blue plastic overlay on the reading material. To test this, 100 dyslexic children were randomly assigned to one of two groups, one of which read from pages with a clear plastic overlay and the other of which read from pages with a blue plastic overlay. The dependent variable was percentage correct on a multiple-choice reading comprehension test. a) Is this an observational study or an experiment? Explain your choice. b) Why did the researcher use a clear overlay as one of the treatment groups instead of just having the children read the passage without an…Dyslexia refers to a specific reading disability that affects 10% to 15% of the general population. A dyslexic child is defined as a child of normal or above-normal intelligence with no known organic behavioural disorders who, despite normal schooling, shows a reading lag of at least two years. A researcher proposed that dyslexia was the result of a complex visual deficit that could be immediately corrected by simply putting a blue plastic overlay on the reading material. To test this, 100 dyslexic children were randomly assigned to one of two groups, one of which read from pages with a clear plastic overlay and the other of which read from pages with a blue plastic overlay. The dependent variable was percentage correct on a multiple-choice reading comprehension test. What assumptions for the hypothesis test would need to be conducted for a one sample t test? Which data on spss would i need to look at for the assumptions?
- Is the following statement true or false? “The single-phase, single-channel model with Poisson arrivals and undefined service times will always have larger (i.e., greater) operating characteristic values (i.e., W,Wq, L, Lq ) than the same model with exponentially distributed service times.” Explain your answer.Researchers have noted a decline in cognitive functioning as people age (Bartus, 1990). However, theresults from other research suggest that the antioxidants in foods such as blueberries can reduce andeven reverse these age-related declines, at least inlaboratory rats (Joseph et al., 1999). Based on theseresults, one might theorize that the same antioxidants might also benefit elderly humans. Supposea researcher is interested in testing this theory. Theresearcher obtains a sample of n = 16 adults who areolder than 65, and gives each participant a daily doseof a blueberry supplement that is very high in antioxidants. After taking the supplement for 6 months, theparticipants are given a standardized cognitive skillstest and produce a mean score of M = 50.2. For thegeneral population of elderly adults, scores on the testaverage μ = 45 and form a normal distribution withσ = 9.a. Can the researcher conclude that the supplementhas a significant effect on cognitive skill? Use atwo-tailed test…Conduct a t-test at the .01 level. Find the correct conclusion about the research hypothesis. (A) Therefore, there is a statistically significant difference in the population mean income between the two groups. (B) Therefore, the population mean income of group 1 is statistically significantly smaller than that of group 2. (C) Therefore, the population mean income of group 1 is statistically significantly greater than that of group 2. (D) Therefore, there is NO statistically significant difference in the population mean income between the two groups. (E) Therefore, the population mean income of group 1 is NOT statistically significantly smaller than that of group 2. (F) Therefore, the population mean income of group 1 is NOT statistically significantly greater than that of group 2.
- Researchers measured the distribution of beak sizes in a cohort of medium ground finch hatchlings in the Galapagos Islands in 1976 just before, and in a cohort of hatchlings two years after a severe drought. They measured 100 finches in each cohort. After the drought, the proportion of large, harder seeds was substantially greater than before the drought. Their data documenting this selective event are shown in graphical and tabular form below. Beak size (mm) Frequency before selection Frequency after selection 10.010.0 0.000.00 0.000.00 10.210.2 0.000.00 0.000.00 10.410.4 0.020.02 0.000.00 10.610.6 0.040.04 0.000.00 10.810.8 0.080.08 0.000.00 11.011.0 0.160.16 0.000.00 11.211.2 0.200.20 0.000.00 11.411.4 0.200.20 0.000.00 11.611.6 0.160.16 0.020.02 11.811.8 0.080.08 0.040.04 12.012.0 0.040.04 0.080.08 12.212.2 0.020.02 0.160.16 12.412.4 0.000.00 0.200.20 12.612.6 0.000.00 0.200.20 12.812.8 0.000.00 0.160.16 13.013.0 0.000.00 0.080.08 13.213.2…Note- bolded quiz have already answered A possible important environmental determinant of lung function in children is the amount of cigarette smoking in the home. Suppose this question is studied by selecting two groups: Group 1 consists of 23 nonsmoking children 5-9 years of age, both of whose parents smoke, who have a mean forced expiratory volume (FEV) of 2.1 L and a standard deviation of 0.7 L; group 2 consists of 20 nonsmoking children of comparable age, neither of whose parents smoke, who have a mean FEV of 2.3 L and a standard deviation of 0.4 L.*8.31 What are the appropriate null and alternative hypotheses to compare the means of the two groups? *8.32 What is the appropriate test procedure for the hypotheses in Problem 8.31? *8.33 Carry out the test in Problem 8.32 using the criticalvalue method. *8.34 Provide a 95% CI for the true mean difference in FEV between 5- to 9-year-old children whose parents smoke and comparable children whose parents do not smoke. *8.35 Assuming…Second-Hand Smoke: Data Set 12 “Passive and Active Smoke” in Appendix B includes cotinine levels measured in a group of nonsmokers exposed to tobacco smoke (n = 40, Mean = 60.58 ng>mL, s = 138.08 ng>mL) and a group of nonsmokers not exposed to tobacco smoke (n = 40, Mean = 16.35 ng>mL, s = 62.53 ng>mL). Cotinine is a metabolite of nicotine, meaning that when nicotine is absorbed by the body, cotinine is produced. Use a 0.05 significance level to test the claim that nonsmokers exposed to tobacco smoke have a higher mean cotinine level than nonsmokers not exposed to tobacco smoke. Construct the confidence interval appropriate for the hypothesis test in part a. What do you conclude about the effects of second-hand smoke?