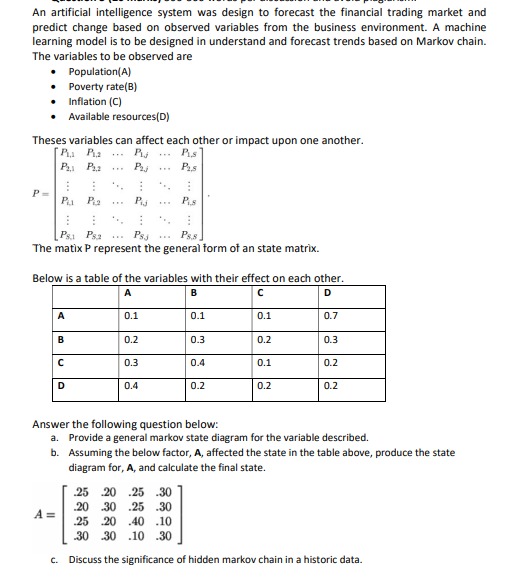
An artificial intelligence system was design to forecast the financial trading market and predict change based on observed variables from the business environment. A machine learning model is to be designed in understand and forecast trends based on Markov chain. The variables to be observed are • Population(A) • Poverty rate(B) • Inflation (C) Available resources(D) Theses variables can affect each other or impact upon one another. P. R2 PI P1 P2 P/ Pis Pus P- P1 P2 PA Ps Ps2 The matix P represent the general form of an state matrix. Below is a table of the variables with their effect on each other. А B с D A 0.1 0.1 0.1 0.7 B 0.2 0.3 0.2 0.3 с 0.3 0.4 0.1 0.2 D 0.4 0.2 0.2 0.2 Answer the following question below: a. Provide a general markov state diagram for the variable described. b. Assuming the below factor, A, affected the state in the table above, produce the state diagram for, A, and calculate the final state. 25 20 25 30 .20 30 25 30 A= 25 20.40.10 30 30.10.30 c. Discuss the significance of hidden markov chain in a historic data.


An

Step by step
Solved in 2 steps with 1 images


