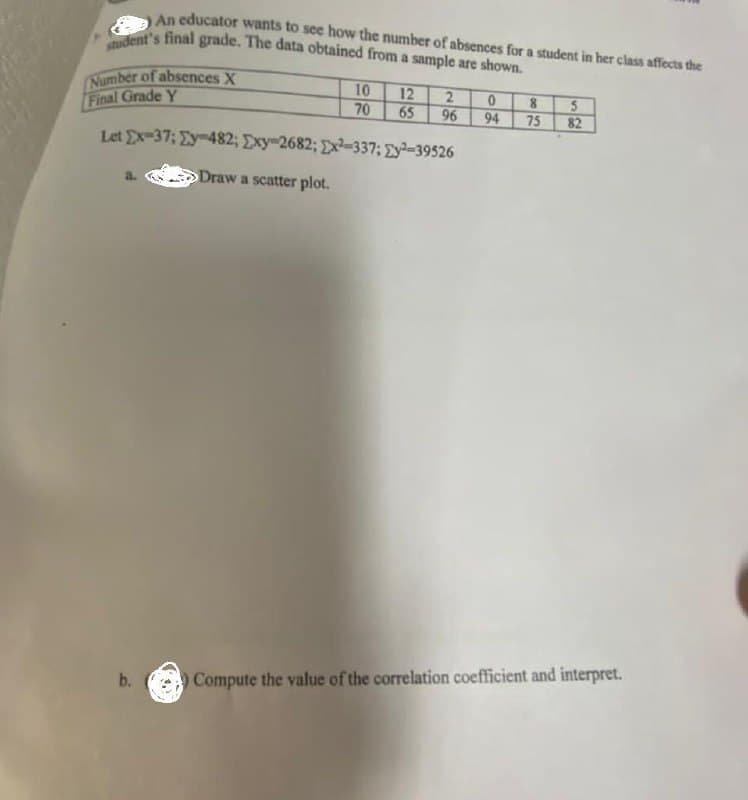
An educator wants to see how the number of absences for a student in her class affects the student's final grade. The data obtained from a sample are shown. 2 10 12 2 Number of absences X Final Grade Y 0 8 5 70 65 96 94 75 82 Let Ex-37; Ey-482; Exy-2682; x-337; ²-39526 Draw a scatter plot. Compute the value of the correlation coefficient and interpret. b.
An educator wants to see how the number of absences for a student in her class affects the student's final grade. The data obtained from a sample are shown. 2 10 12 2 Number of absences X Final Grade Y 0 8 5 70 65 96 94 75 82 Let Ex-37; Ey-482; Exy-2682; x-337; ²-39526 Draw a scatter plot. Compute the value of the correlation coefficient and interpret. b.

Glencoe Algebra 1, Student Edition, 9780079039897, 0079039898, 2018
18th Edition
ISBN:9780079039897
Author:Carter
Publisher:Carter
Chapter4: Equations Of Linear Functions
Section4.4: Scatter Plots And Line Of Fit
Problem 18PFA

Related questions
Question
Transcribed Image Text:An educator wants to see how the number of absences for a student in her class affects the
&
student's final grade. The data obtained from a sample are shown.
10
12
2
Number of absences X
Final Grade Y
0
8
5
70
65
96
94
75
82
Let Ex-37; Ey-482; Exy-2682; x-337;
²-39526
Draw a scatter plot.
Compute the value of the correlation coefficient and interpret.
b.
433
Expert Solution
This question has been solved!
Explore an expertly crafted, step-by-step solution for a thorough understanding of key concepts.

This is a popular solution!

Trending now
This is a popular solution!

Step by step
Solved in 3 steps with 9 images

Recommended textbooks for you
Glencoe Algebra 1, Student Edition, 9780079039897…
Algebra
ISBN:
9780079039897
Author:
Carter
Publisher:
McGraw Hill

Big Ideas Math A Bridge To Success Algebra 1: Stu…
Algebra
ISBN:
9781680331141
Author:
HOUGHTON MIFFLIN HARCOURT
Publisher:
Houghton Mifflin Harcourt
Glencoe Algebra 1, Student Edition, 9780079039897…
Algebra
ISBN:
9780079039897
Author:
Carter
Publisher:
McGraw Hill
Big Ideas Math A Bridge To Success Algebra 1: Stu…
Algebra
ISBN:
9781680331141
Author:
HOUGHTON MIFFLIN HARCOURT
Publisher:
Houghton Mifflin Harcourt