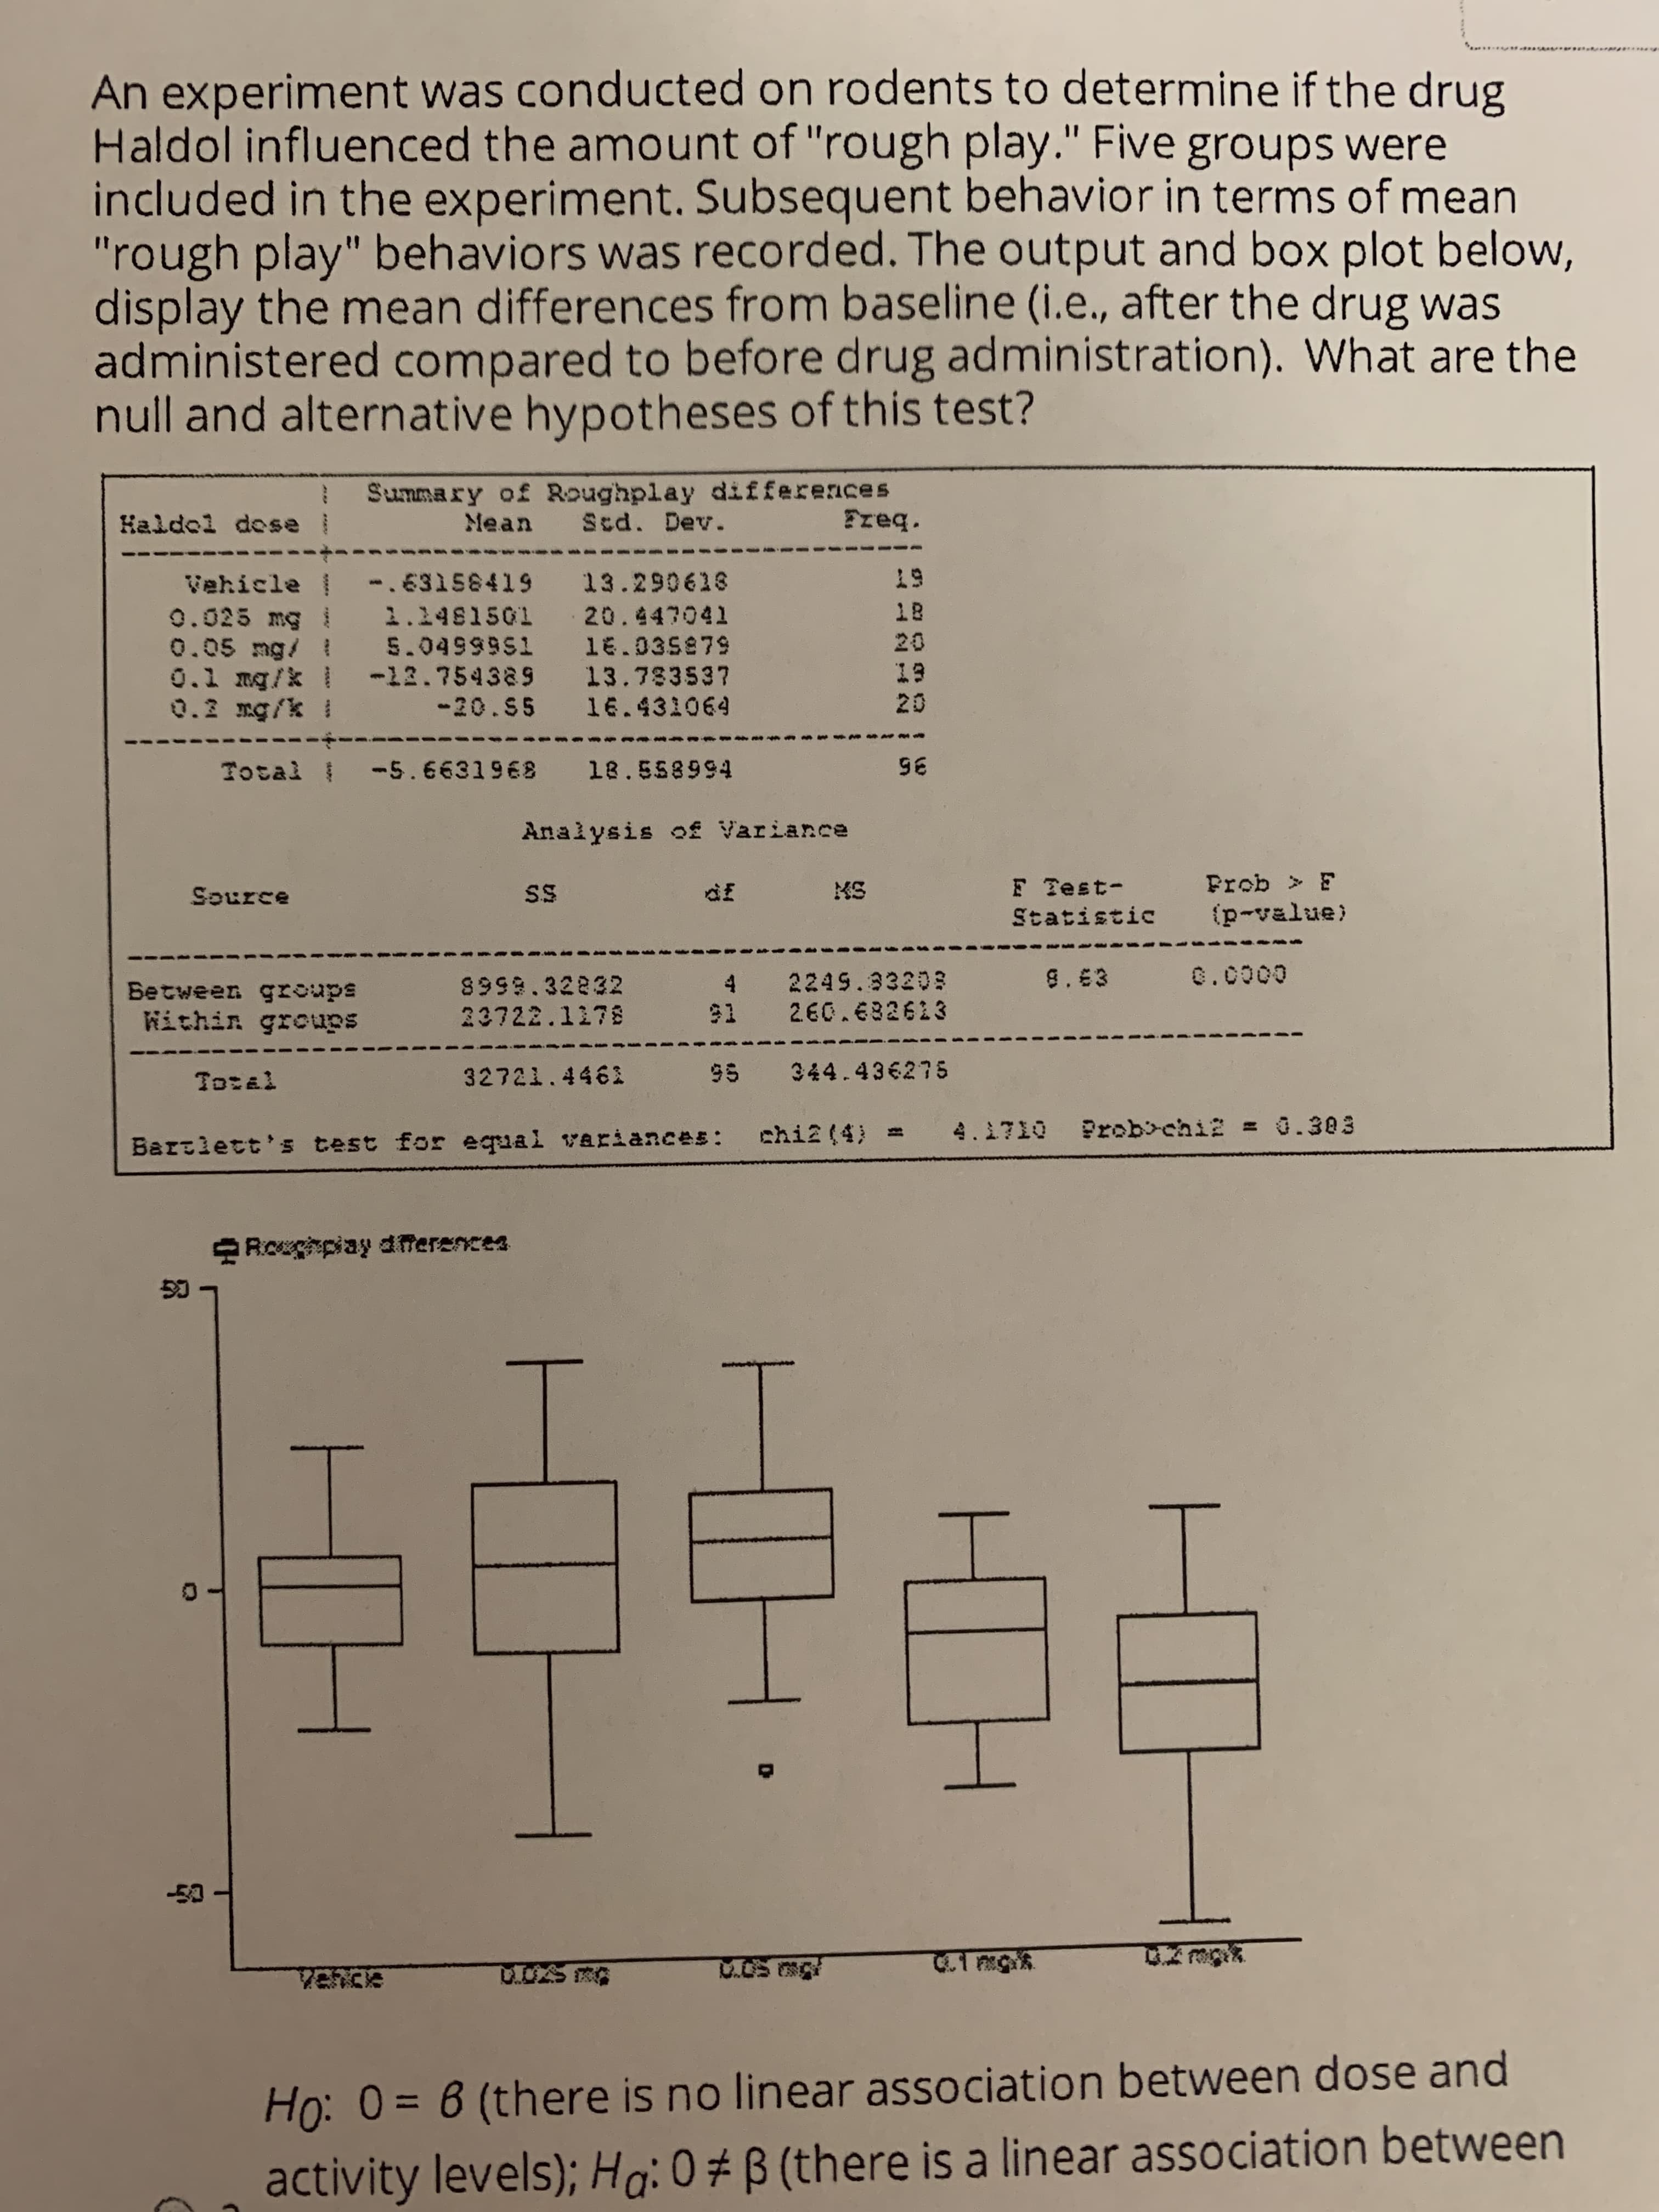
An experiment was conducted on rodents to determine if the drug Haldol influenced the amount of "rough play." Five groups were included in the experiment. Subsequent behavior in terms of mean "rough play" behaviors was recorded. The output and box plot below, display the mean differences from baseline (i.e., after the drug was administered compared to before drug administration). What are the null and alternative hypotheses of this test? Summary of Roughplay differences Scd. Dev. Haldol dese Mean Freq. -.63158419 13.290618 19 Vehicle | 0.025 mg i 0.05 mg/ 1 0.1 mg/k -12.754389 13.783537 0.2 mg/k I 18 1.1481501 20.447041 5.0499951 16.035879 20 19 -20.S5 16.431064 20 Total -5.6631968 1B.558994 96 Analysis of Variance Frob F (p-value) Source SS df KS F Test- Statistic 8999.32832 4 2249.33203 9.63 0.0000 Between groups Within groups 91 260.682623 23722.1178 Tozal 32721.4461 95 344.436275 chif (4) 4.1710 Prob>chiz = 0.303 = Bartlett's test for equal variances: Roeghpiay diferences -50 Ho: 0 = 6 (there is no linear association between dose and %3D activity levels); Ho: 0 # B (there is a linear association between # 29 H: 0 = 6 (there is no linear association between dose and activity levels); H,: 0 ± a B (there is a linear association between dose and activity levels) H: 1 = 2 = 3 = 4 = 5; H,: At least one dose group is different from at least one of the others %3D %3D %3D H: There is no association between dose and activity; H,: There is an association c (as measured by the chi-square test) d Ho: = B; H,: 0 # p (i.e., there is no linear association between dose and activity · level versus there is a linear association) %3D
An experiment was conducted on rodents to determine if the drug Haldol influenced the amount of "rough play." Five groups were included in the experiment. Subsequent behavior in terms of mean "rough play" behaviors was recorded. The output and box plot below, display the mean differences from baseline (i.e., after the drug was administered compared to before drug administration). What are the null and alternative hypotheses of this test? Summary of Roughplay differences Scd. Dev. Haldol dese Mean Freq. -.63158419 13.290618 19 Vehicle | 0.025 mg i 0.05 mg/ 1 0.1 mg/k -12.754389 13.783537 0.2 mg/k I 18 1.1481501 20.447041 5.0499951 16.035879 20 19 -20.S5 16.431064 20 Total -5.6631968 1B.558994 96 Analysis of Variance Frob F (p-value) Source SS df KS F Test- Statistic 8999.32832 4 2249.33203 9.63 0.0000 Between groups Within groups 91 260.682623 23722.1178 Tozal 32721.4461 95 344.436275 chif (4) 4.1710 Prob>chiz = 0.303 = Bartlett's test for equal variances: Roeghpiay diferences -50 Ho: 0 = 6 (there is no linear association between dose and %3D activity levels); Ho: 0 # B (there is a linear association between # 29 H: 0 = 6 (there is no linear association between dose and activity levels); H,: 0 ± a B (there is a linear association between dose and activity levels) H: 1 = 2 = 3 = 4 = 5; H,: At least one dose group is different from at least one of the others %3D %3D %3D H: There is no association between dose and activity; H,: There is an association c (as measured by the chi-square test) d Ho: = B; H,: 0 # p (i.e., there is no linear association between dose and activity · level versus there is a linear association) %3D

Glencoe Algebra 1, Student Edition, 9780079039897, 0079039898, 2018
18th Edition
ISBN:9780079039897
Author:Carter
Publisher:Carter
Chapter10: Statistics
Section10.3: Measures Of Spread
Problem 1GP

Related questions
Question
Transcribed Image Text:An experiment was conducted on rodents to determine if the drug
Haldol influenced the amount of "rough play." Five groups were
included in the experiment. Subsequent behavior in terms of mean
"rough play" behaviors was recorded. The output and box plot below,
display the mean differences from baseline (i.e., after the drug was
administered compared to before drug administration). What are the
null and alternative hypotheses of this test?
Summary of Roughplay differences
Scd. Dev.
Haldol dese
Mean
Freq.
-.63158419 13.290618
19
Vehicle |
0.025 mg i
0.05 mg/ 1
0.1 mg/k -12.754389 13.783537
0.2 mg/k I
18
1.1481501 20.447041
5.0499951 16.035879
20
19
-20.S5 16.431064
20
Total -5.6631968 1B.558994
96
Analysis of Variance
Frob F
(p-value)
Source
SS
df
KS
F Test-
Statistic
8999.32832
4 2249.33203
9.63
0.0000
Between groups
Within groups
91 260.682623
23722.1178
Tozal
32721.4461
95 344.436275
chif (4)
4.1710 Prob>chiz = 0.303
=
Bartlett's test for equal variances:
Roeghpiay diferences
-50
Ho: 0 = 6 (there is no linear association between dose and
%3D
activity levels); Ho: 0 # B (there is a linear association between
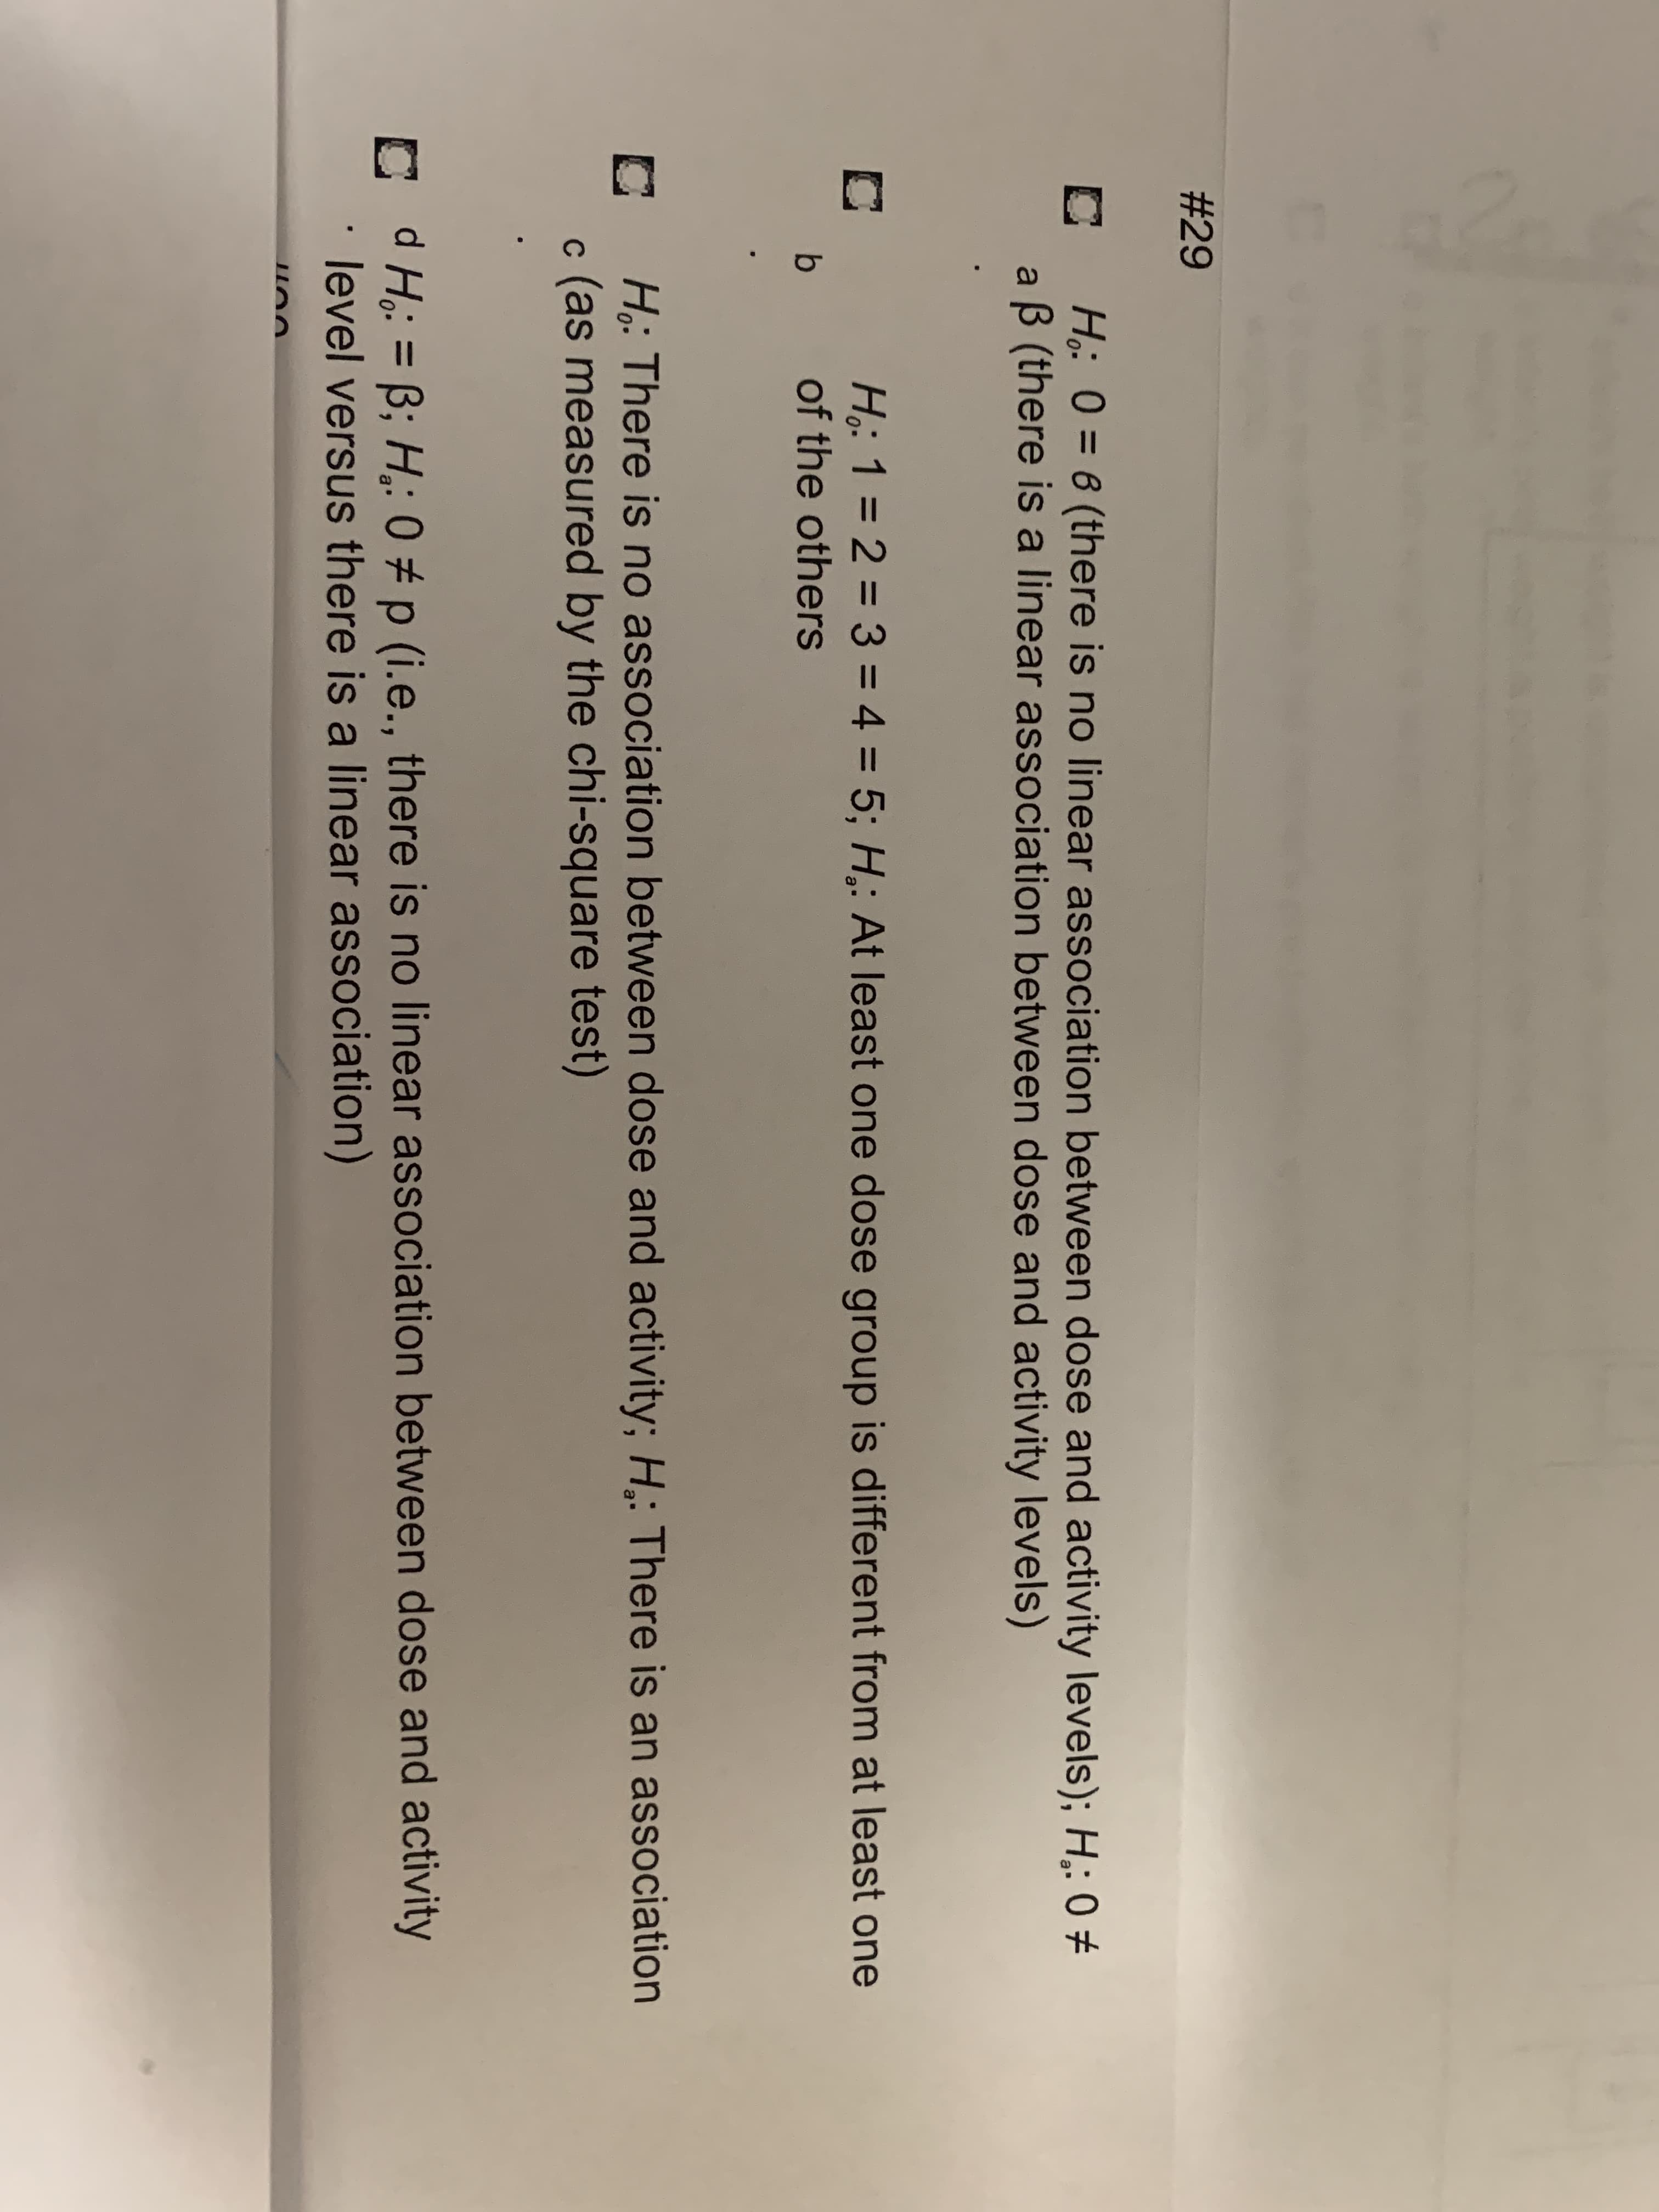
Transcribed Image Text:# 29
H: 0 = 6 (there is no linear association between dose and activity levels); H,: 0 ±
a B (there is a linear association between dose and activity levels)
H: 1 = 2 = 3 = 4 = 5; H,: At least one dose group is different from at least one
of the others
%3D
%3D
%3D
H: There is no association between dose and activity; H,: There is an association
c (as measured by the chi-square test)
d Ho: = B; H,: 0 # p (i.e., there is no linear association between dose and activity
· level versus there is a linear association)
%3D
Expert Solution
This question has been solved!
Explore an expertly crafted, step-by-step solution for a thorough understanding of key concepts.

This is a popular solution!

Trending now
This is a popular solution!

Step by step
Solved in 2 steps with 1 images

Recommended textbooks for you
Glencoe Algebra 1, Student Edition, 9780079039897…
Algebra
ISBN:
9780079039897
Author:
Carter
Publisher:
McGraw Hill
Glencoe Algebra 1, Student Edition, 9780079039897…
Algebra
ISBN:
9780079039897
Author:
Carter
Publisher:
McGraw Hill