Fish Biomass Data y x1 x2 X3 x4 100 14.3 15.0 12.2 48.0 388 19.1 29.4 26.0 152.2 755 54.6 58.0 24.2 469.7 1288 28.8 42.6 26.1 485.9 230 16.1 15.9 31.6 87.6 0 10.0 56.4 23.3 6.9 551 28.5 95.1 13.0 192.9 345 13.8 60.6 7.5 105.8 0 10.7 35.2 40.3 0.0 348 25.9 52.0 40.3 116.6 - ☑ An experiment was conducted to study the effect of stream characteristics on fish biomass. The regressor variables are as follows: average depth (of 50 cells), x₁; area of in-stream cover (i.e., undercut banks, logs, boulders, etc.), x2; percent canopy cover (average of 12), x3; and area ≥ 25 centimeters in depth, x4. The response is y, the fish biomass. Use the accompanying data to complete parts (a) through (c). Click the icon to view the fish biomass data. (a) Fit a multiple linear regression including all four regression variables. ŷ = 86 + ( 16 ) ×₁ + (2.42) x2 + (1.83) ×3 + (3.07) ×4 (Round the constant and x₁-coefficient to the nearest integer as needed. Round all other coefficients to two decimal places as needed.) (b) Use C., R², and s² to determine the best subsets of variables. Compute these statistics for all possible subsets. Find the two models which use the best subset of variables. Select both of these models below. B. X3X4 A. X2x3 D. X1x3 E. X1 X3 X4 H. X2X3X4 G. x₁ K. X2X4 J. X₁x2x3 N. X1 X2 ୮ M. x4 C. X₁x4 x2 1. хахахаха X3
Fish Biomass Data y x1 x2 X3 x4 100 14.3 15.0 12.2 48.0 388 19.1 29.4 26.0 152.2 755 54.6 58.0 24.2 469.7 1288 28.8 42.6 26.1 485.9 230 16.1 15.9 31.6 87.6 0 10.0 56.4 23.3 6.9 551 28.5 95.1 13.0 192.9 345 13.8 60.6 7.5 105.8 0 10.7 35.2 40.3 0.0 348 25.9 52.0 40.3 116.6 - ☑ An experiment was conducted to study the effect of stream characteristics on fish biomass. The regressor variables are as follows: average depth (of 50 cells), x₁; area of in-stream cover (i.e., undercut banks, logs, boulders, etc.), x2; percent canopy cover (average of 12), x3; and area ≥ 25 centimeters in depth, x4. The response is y, the fish biomass. Use the accompanying data to complete parts (a) through (c). Click the icon to view the fish biomass data. (a) Fit a multiple linear regression including all four regression variables. ŷ = 86 + ( 16 ) ×₁ + (2.42) x2 + (1.83) ×3 + (3.07) ×4 (Round the constant and x₁-coefficient to the nearest integer as needed. Round all other coefficients to two decimal places as needed.) (b) Use C., R², and s² to determine the best subsets of variables. Compute these statistics for all possible subsets. Find the two models which use the best subset of variables. Select both of these models below. B. X3X4 A. X2x3 D. X1x3 E. X1 X3 X4 H. X2X3X4 G. x₁ K. X2X4 J. X₁x2x3 N. X1 X2 ୮ M. x4 C. X₁x4 x2 1. хахахаха X3

Algebra & Trigonometry with Analytic Geometry
13th Edition
ISBN:9781133382119
Author:Swokowski
Publisher:Swokowski
Chapter7: Analytic Trigonometry
Section7.6: The Inverse Trigonometric Functions
Problem 91E
Question
I need help with part b please to find the two models which use the best subset of variables. thanks
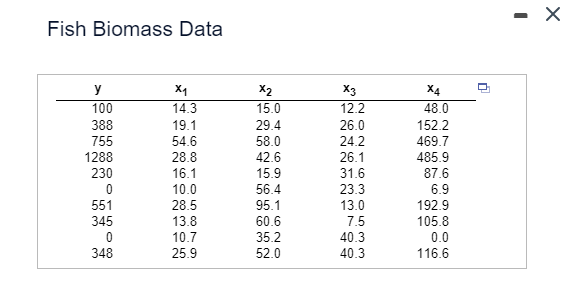
Transcribed Image Text:Fish Biomass Data
y
x1
x2
X3
x4
100
14.3
15.0
12.2
48.0
388
19.1
29.4
26.0
152.2
755
54.6
58.0
24.2
469.7
1288
28.8
42.6
26.1
485.9
230
16.1
15.9
31.6
87.6
0
10.0
56.4
23.3
6.9
551
28.5
95.1
13.0
192.9
345
13.8
60.6
7.5
105.8
0
10.7
35.2
40.3
0.0
348
25.9
52.0
40.3
116.6
-
☑
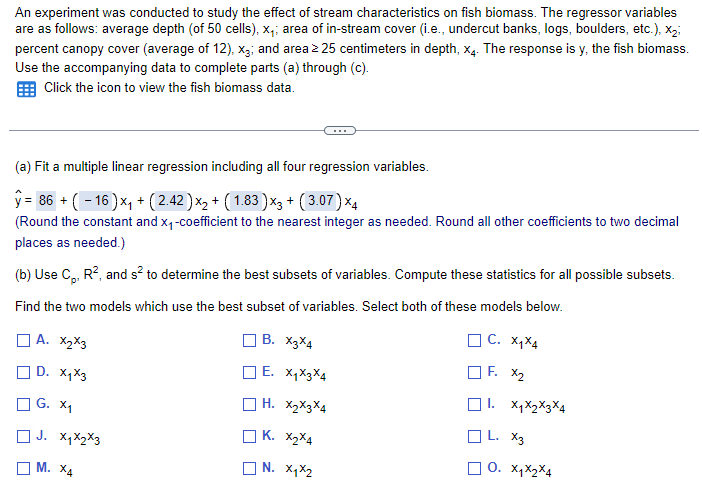
Transcribed Image Text:An experiment was conducted to study the effect of stream characteristics on fish biomass. The regressor variables
are as follows: average depth (of 50 cells), x₁; area of in-stream cover (i.e., undercut banks, logs, boulders, etc.), x2;
percent canopy cover (average of 12), x3; and area ≥ 25 centimeters in depth, x4. The response is y, the fish biomass.
Use the accompanying data to complete parts (a) through (c).
Click the icon to view the fish biomass data.
(a) Fit a multiple linear regression including all four regression variables.
ŷ = 86 + ( 16 ) ×₁ + (2.42) x2 + (1.83) ×3 + (3.07) ×4
(Round the constant and x₁-coefficient to the nearest integer as needed. Round all other coefficients to two decimal
places as needed.)
(b) Use C., R², and s² to determine the best subsets of variables. Compute these statistics for all possible subsets.
Find the two models which use the best subset of variables. Select both of these models below.
B. X3X4
A. X2x3
D. X1x3
E. X1 X3 X4
H. X2X3X4
G. x₁
K. X2X4
J. X₁x2x3
N. X1 X2
୮
M. x4
C. X₁x4
x2
1. хахахаха
X3
Expert Solution
This question has been solved!
Explore an expertly crafted, step-by-step solution for a thorough understanding of key concepts.

Step by step
Solved in 2 steps

Recommended textbooks for you
Algebra & Trigonometry with Analytic Geometry
Algebra
ISBN:
9781133382119
Author:
Swokowski
Publisher:
Cengage


Functions and Change: A Modeling Approach to Coll…
Algebra
ISBN:
9781337111348
Author:
Bruce Crauder, Benny Evans, Alan Noell
Publisher:
Cengage Learning
Algebra & Trigonometry with Analytic Geometry
Algebra
ISBN:
9781133382119
Author:
Swokowski
Publisher:
Cengage
Functions and Change: A Modeling Approach to Coll…
Algebra
ISBN:
9781337111348
Author:
Bruce Crauder, Benny Evans, Alan Noell
Publisher:
Cengage Learning