An industrial psychologist has designed a study to evaluate the effects of a new profit-sharing incentive plan on productivity for a local organization in The company has 8 teams. The number of units produced by each team during the eight week prior to the beginning of the new incentive plan and for e afterward is presented below. Test whether the new incentive plan had an effect on productivity at a significance level of .05 (non-directional test) by an questions below. BEFORE: 85, 79, 78, 80, 81, 108, 76, 67 AFTER: 89, 85, 83, 75, 87, 106, 80, 73
An industrial psychologist has designed a study to evaluate the effects of a new profit-sharing incentive plan on productivity for a local organization in The company has 8 teams. The number of units produced by each team during the eight week prior to the beginning of the new incentive plan and for e afterward is presented below. Test whether the new incentive plan had an effect on productivity at a significance level of .05 (non-directional test) by an questions below. BEFORE: 85, 79, 78, 80, 81, 108, 76, 67 AFTER: 89, 85, 83, 75, 87, 106, 80, 73

Glencoe Algebra 1, Student Edition, 9780079039897, 0079039898, 2018
18th Edition
ISBN:9780079039897
Author:Carter
Publisher:Carter
Chapter10: Statistics
Section: Chapter Questions
Problem 13PT

Related questions
Question
1.what are the dum of different scores and the sum of squared difference score?
2. find t observed by use the formula below

Transcribed Image Text:An industrial psychologist has designed a study to evaluate the effects of a new profit-sharing incentive plan on productivity for a local organization in New York.
The company has 8 teams. The number of units produced by each team during the eight week prior to the beginning of the new incentive plan and for eight weeks
afterward is presented below. Test whether the new incentive plan had an effect on productivity at a significance level of .05 (non-directional test) by answering the
questions below.
BEFORE: 85, 79, 78, 80, 81, 108, 76, 67
AFTER: 89, 85, 83, 75, 87, 106, 80, 73
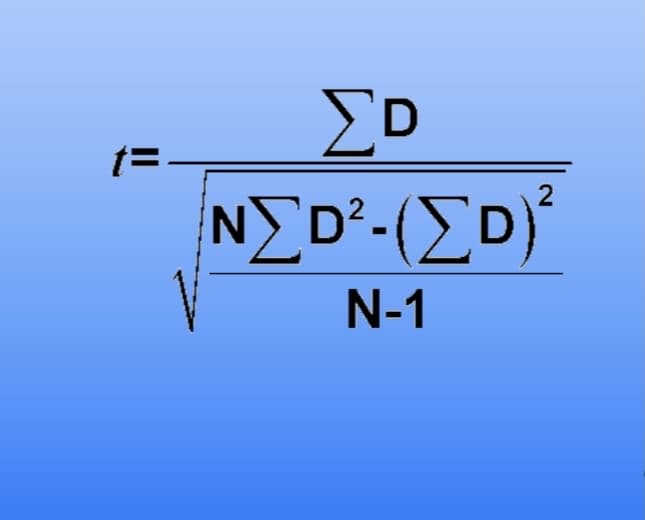
Transcribed Image Text:ΣΕ
D
NΣΟ-(ΣΔ)
N-1
2
Expert Solution
This question has been solved!
Explore an expertly crafted, step-by-step solution for a thorough understanding of key concepts.

Step by step
Solved in 2 steps

Recommended textbooks for you
Glencoe Algebra 1, Student Edition, 9780079039897…
Algebra
ISBN:
9780079039897
Author:
Carter
Publisher:
McGraw Hill

Holt Mcdougal Larson Pre-algebra: Student Edition…
Algebra
ISBN:
9780547587776
Author:
HOLT MCDOUGAL
Publisher:
HOLT MCDOUGAL
Glencoe Algebra 1, Student Edition, 9780079039897…
Algebra
ISBN:
9780079039897
Author:
Carter
Publisher:
McGraw Hill
Holt Mcdougal Larson Pre-algebra: Student Edition…
Algebra
ISBN:
9780547587776
Author:
HOLT MCDOUGAL
Publisher:
HOLT MCDOUGAL