An ore sample was analyzed for its Fe content. Student A analyzed the sample a total of six times and her results had a standard deviation of 1.33. The same sample was analyzed five times by Student B and his results had a standard deviation of 3.42. To determine if their standard deviations are similar, they perform an F test. The calculated F value is is , and the table value of F Refer to Table 4-3 for critical values of F. The two sets of measurements come from populations with the same standard deviations. The two sets of measurements come from populations with different population means. The two sets of measurements come from 3 populations with the same population mean and different population standard deviations. 2.
An ore sample was analyzed for its Fe content. Student A analyzed the sample a total of six times and her results had a standard deviation of 1.33. The same sample was analyzed five times by Student B and his results had a standard deviation of 3.42. To determine if their standard deviations are similar, they perform an F test. The calculated F value is is , and the table value of F Refer to Table 4-3 for critical values of F. The two sets of measurements come from populations with the same standard deviations. The two sets of measurements come from populations with different population means. The two sets of measurements come from 3 populations with the same population mean and different population standard deviations. 2.

Glencoe Algebra 1, Student Edition, 9780079039897, 0079039898, 2018
18th Edition
ISBN:9780079039897
Author:Carter
Publisher:Carter
Chapter10: Statistics
Section10.3: Measures Of Spread
Problem 26PFA

Related questions
Topic Video
Question
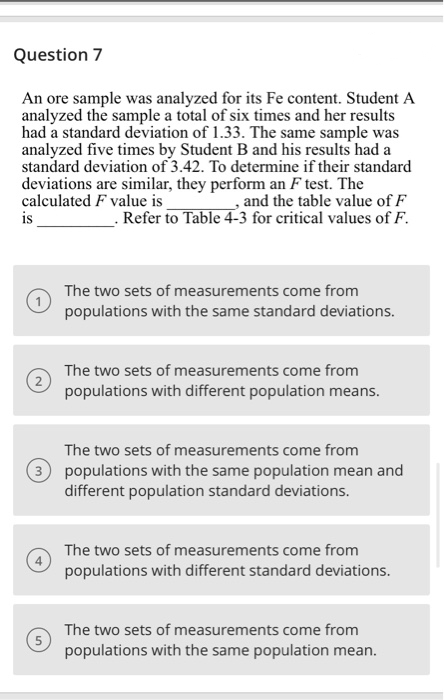
Transcribed Image Text:Question 7
An ore sample was analyzed for its Fe content. Student A
analyzed the sample a total of six times and her results
had a standard deviation of 1.33. The same sample was
analyzed five times by Student B and his results had a
standard deviation of 3.42. To determine if their standard
deviations are similar, they perform an F test. The
calculated F value is
is
and the table value of F
- Refer to Table 4-3 for critical values of F.
The two sets of measurements come from
populations with the same standard deviations.
The two sets of measurements come from
populations with different population means.
The two sets of measurements come from
3 populations with the same population mean and
different population standard deviations.
The two sets of measurements come from
populations with different standard deviations.
The two sets of measurements come from
populations with the same population mean.
Expert Solution
This question has been solved!
Explore an expertly crafted, step-by-step solution for a thorough understanding of key concepts.

This is a popular solution!

Trending now
This is a popular solution!

Step by step
Solved in 2 steps

Knowledge Booster


Learn more about
Need a deep-dive on the concept behind this application? Look no further. Learn more about this topic, statistics and related others by exploring similar questions and additional content below.Recommended textbooks for you
Glencoe Algebra 1, Student Edition, 9780079039897…
Algebra
ISBN:
9780079039897
Author:
Carter
Publisher:
McGraw Hill
Glencoe Algebra 1, Student Edition, 9780079039897…
Algebra
ISBN:
9780079039897
Author:
Carter
Publisher:
McGraw Hill