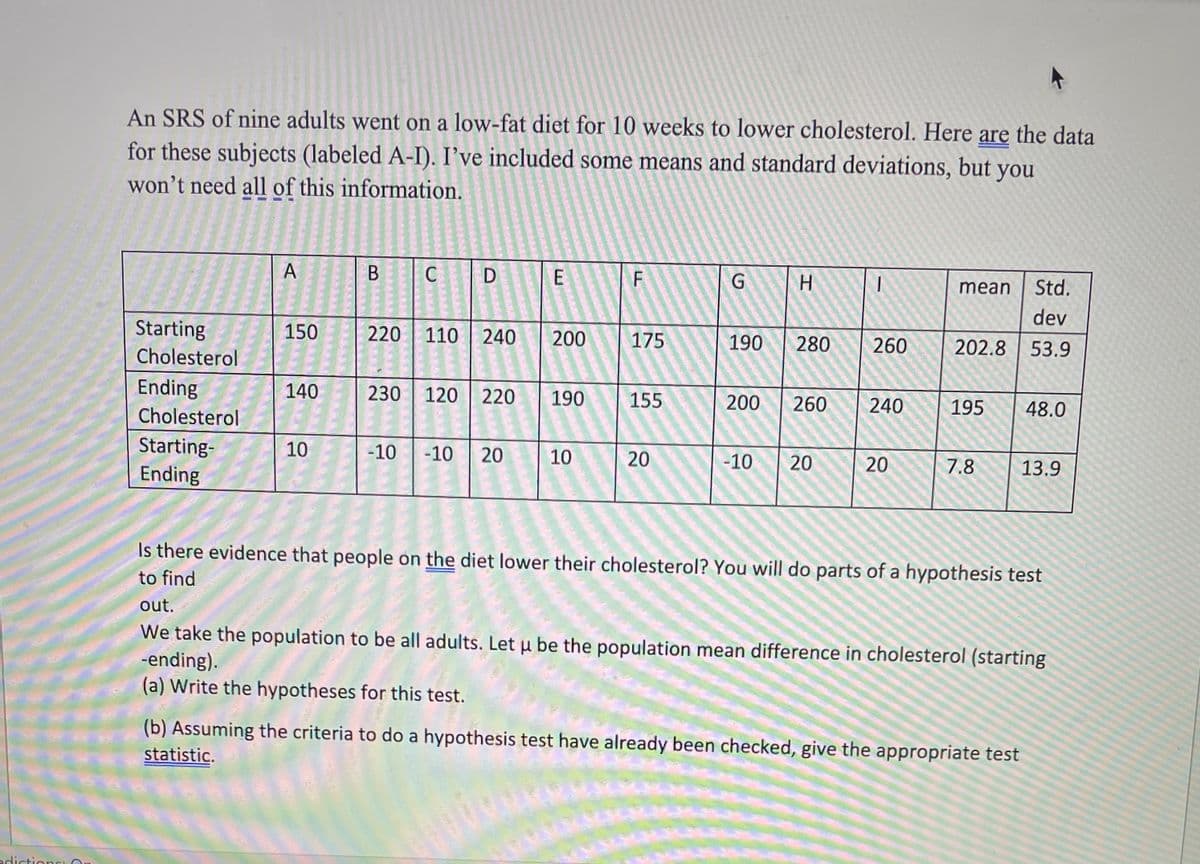
An SRS of nine adults went on a low-fat diet for 10 weeks to lower cholesterol. Here are the data for these subjects (labeled A-I). I've included some means and standard deviations, but you won't need all of this information. A C F mean Std. dev Starting Cholesterol 150 220 110 240 200 175 190 280 260 202.8 53.9 Ending Cholesterol 140 230 120 220 190 155 200 260 240 195 48.0 Starting- Ending 10 -10 -10 10 20 -10 20 20 7.8 13.9 Is there evidence that people on the diet lower their cholesterol? You will do parts of a hypothesis test to find out. We take the population to be all adults. Let u be the population mean difference in cholesterol (starting -ending). (a) Write the hypotheses for this test. (b) Assuming the criteria to do a hypothesis test have already been checked, give the appropriate test statistic. 20 B.
An SRS of nine adults went on a low-fat diet for 10 weeks to lower cholesterol. Here are the data for these subjects (labeled A-I). I've included some means and standard deviations, but you won't need all of this information. A C F mean Std. dev Starting Cholesterol 150 220 110 240 200 175 190 280 260 202.8 53.9 Ending Cholesterol 140 230 120 220 190 155 200 260 240 195 48.0 Starting- Ending 10 -10 -10 10 20 -10 20 20 7.8 13.9 Is there evidence that people on the diet lower their cholesterol? You will do parts of a hypothesis test to find out. We take the population to be all adults. Let u be the population mean difference in cholesterol (starting -ending). (a) Write the hypotheses for this test. (b) Assuming the criteria to do a hypothesis test have already been checked, give the appropriate test statistic. 20 B.

Glencoe Algebra 1, Student Edition, 9780079039897, 0079039898, 2018
18th Edition
ISBN:9780079039897
Author:Carter
Publisher:Carter
Chapter10: Statistics
Section10.4: Distributions Of Data
Problem 19PFA

Related questions
Question
Transcribed Image Text:An SRS of nine adults went on a low-fat diet for 10 weeks to lower cholesterol. Here are the data
for these subjects (labeled A-I). I've included some means and standard deviations, but you
won’t need all of this information.
A
C
F
G.
mean
Std.
dev
Starting
150
220
110 240
200
175
190
280
260
202.8
53.9
Cholesterol
Ending
140
230
120
220
190
155
200
260
240
195
48.0
Cholesterol
Starting-
Ending
10
-10
-10
20
10
20
-10
20
7.8
13.9
Is there evidence that people on the diet lower their cholesterol? You will do parts of a hypothesis test
to find
out.
We take the population to be all adults. Let u be the population mean difference in cholesterol (starting
-ending).
(a) Write the hypotheses for this test.
(b) Assuming the criteria to do a hypothesis test have already been checked, give the appropriate test
statistic.
edictio
20
Expert Solution
This question has been solved!
Explore an expertly crafted, step-by-step solution for a thorough understanding of key concepts.

This is a popular solution!

Trending now
This is a popular solution!

Step by step
Solved in 3 steps

Recommended textbooks for you
Glencoe Algebra 1, Student Edition, 9780079039897…
Algebra
ISBN:
9780079039897
Author:
Carter
Publisher:
McGraw Hill
Glencoe Algebra 1, Student Edition, 9780079039897…
Algebra
ISBN:
9780079039897
Author:
Carter
Publisher:
McGraw Hill