An unbiased estimator is said to be consistent if the difference between the estimator and the population parameter grows smaller as the sample size grows larger.


Q: A regression line is a straight line which: a. is defined by an equation having 2 parameters: the…
A: Answer :- Option (A) is correct. - is defined by an equation having 2 parameters: the slope and the…
Q: With an alpha of 0.05, what fraction of results would you expect to give you a false positive?…
A: The probability of rejecting the null hypothesis when it is true is known as the significance…
Q: Identify the dependent variable in the experiment whose data are shown in the figure above. Identify…
A: Experiments are tests or act done by scientists to validate a hypothesis by providing cause and…
Q: Alternatively, the frequency of a certain trait in a population can be altered by a random process…
A: Evolution is a process in which characteristics or traits of species change over a period of time.…
Q: 1) You compare the height and weight of 5 adult women. You get the following results: height 60 67…
A: Since you have asked multiple question, we will solve the first question for you. If you want any…
Q: In the context of the Chi-square analysis, the null hypothesis states that…
A: The null hypothesis states that there should be no numerical difference between the measured and…
Q: You are examining a scorpion population within the Las Vegas area. Your field team is able to…
A: There are two types of scorpions: yellow and brown. The dominant brown trait is encoded by the…
Q: You have surveyed three (3) populations of organisms (A, B and C) using eleven (11) quadrats of…
A: Variance and standard deviation are closely related measures of variation where both of them show…
Q: If the mean and median pertaining to a certain character of a population are of the same value, what…
A: A population is the entire pool from which a statistical sample is drawn. A population may refer to…
Q: What do you call a sample that goes through all the steps of an experiment but is not exposed to the…
A: A hypothesis made cannot be necessarily right. Instead it is a best guess. however scientists…
Q: If there is no difference between what is observed and what is expected, your chi-square value will…
A: One technique to demonstrate a relationship between two categorical variables is to use a chi-square…
Q: Provide an example of a research project in your hometown where you would choose to use a t-test for…
A: Introduction A statistical hypothesis is a way of assessing parameters in a population for obtaining…
Q: Data Analysis and Graphing in Microsoft Excel Exercise 4: Quantitative Data, Scatter Plots, and…
A: Bergmann’s law states that there is a positive correlation between the change in latitude and the…
Q: Which of the following are variable terms in the discrete-time logistic model? ΔN Δt rmax,d t…
A: Variable: the value which is changed during simulation. Any value that can be changed over time is…
Q: In the following, assume that the goal numbers collected come from a simple random sample of the…
A: Unknown Standard Deviation Means in Two Population --- For two distinct populations following…
Q: clustered random
A: A statistical assessment of the dispersion between values in a data collection is known as a…
Q: The following data represent a sample of a day's water consumption and the high temperature for that…
A: Introduction Dry Water Is A Water–air Emulsion In Which Microscopic Water Droplets The Size Of A…
Q: B. Given the freedom to express your opinion, do you or do you not agree with the idea that a…
A: First of all,Let me explain about Hardy Weinberg law. Hardy Weinberg law states that an allele and…
Q: In chi-squared analysis, by convention, when the p-value for the difference between the observed…
A: Chi-square analysis is a statistical method widely used in the field of genetics. It determines how…
Q: Could you please highlight the correct answer. and explain it
A: The normal distribution is the most widely used and most important distribution in statistics. It…
Q: Hardy-Weinberg principle
A: Definition: Hardy-Weinberg law of genetic equilibrium is that both gene frequencies and genotype…
Q: Major League Baseball (MLB) consists of 30 teams. The earned run average, ERA, is a statistic used…
A:
Q: Which is the correct equation for the chisquare s Group of answer choices )x^2 = x^2 =…
A: A test that evaluates how well a model matches real observed data is the chi-square statistic. A…
Q: What variable will you change in this experiment? This is also called the Independent variable. How…
A: There are so many factors, that are known to affect the activity of an enzyme. Temperature is one of…
Q: If the probability of getting a particular t value is calculated to be 0.02 (in other words, the…
A: Introduction :- Null hypothesis states that everything is equal and everything is same.For example…
Q: The null hypothesis is: That the measured value is zero That the proposed model is not correct and…
A: A hypothesis is a supposition or proposed explanation that is made on the basis of limited evidence…
Q: A correlation coefficient of -0.92 indicates that... Two variables strongly change with one another…
A: The coefficient of correlation depicts the relationship between two variables.
Q: What is the value of a random sample? Will random sampling always ensure that a sample is…
A: Sampling is a statistical method of selecting a sample out of a population to make observation and…
Q: You observe that every time your neighbor, who always wears a yellow hat, walks out his front door,…
A: An experimental setup contains several components: Hypothesis: a guess of the explanation of a…
Q: When a correlational study demonstrates a relationship between two variables, it allows researchers…
A: In research methodology, a correlational study helps to determine whether two variables are…
Q: A correlation between two variables implies that ... one variable may or may not directly affect the…
A: ANSWER;-d) One variable directly affects the other variable. Explain;- Connection is a factual…
Q: By convention, when the difference between the observed experimental outcome and the expected…
A: As it is given that by convention biologists use the 5 %value to determine if observed deviations…
Q: A scientist is measuring blood glucose levels of two individuals over time, which of the following…
A: Every diabetic experiences a variety of events or challenges on a daily basis. "Diabetes" is a…
Q: Given, Hypothesis 1 is "The Suspect is the source of the bloodstain." and Hypothesis 2 is "The…
A: The expression immediately after the term if is the hypothesis of a conditional sentence. The…
Q: Which is the correct equation for the chisquare statistic? Group of answer choices a)x^2 =…
A: Chi-square test: This method is used to determine if two variables are independent of one another…
Q: In a controlled experiment, all of the variables are kept the same in order to be consistent. There…
A: In a controlled experiment, all of the variables are kept the same in order to be consistent. There…
Q: Suppose that you are interested in estimating a population mean. You select a random sample of…
A: A confidence interval for a population mean with a known population standard deviation is based on…
Q: In a controlled experiment all of the variables are kept the same in order to contsistent. there is…
A: Conducting experiments to prove or refute hypotheses is an integral part of the scientific method of…
Q: We can use a descriptive statistical result to make an inferential statistic conclusion True False
A: False.
Q: A Researcher decided to put students into groups based on their Cumulative Weighted Averages and had…
A: Sampling is a procedure which is used in research studies, in a study we generally use data in large…
Q: A Researcher decided to put students into groups based on their Cumulative Weighted Averages and had…
A: Sampling is a procedure which is used in research studies, in a study we generally use data in large…
Q: kt, take Data Set 1 below and do the following: Indicate three variables found in the population…
A: .A population can be said to be an aggregate observation of subjects grouped together by a common…
Q: A population is correctly defined a
A: Option A: incorrect (only I) Option B: Correct (l and ll) Option C: incorrect ( only lll)
Q: Which of the following statistics is used to compare two variables?a. Meanb. Correlation…
A: Statistics is a mathematical branch that deals with datacollection, analysis, organization,…
Q: In your own words describe why we should use both samples to estimate the variance of the population…
A: following is a description about why we should use both samples to estimate the variance of the…
Q: What does P-value indicate? In statistical analysis the results for two sets of data are presented…
A: In statistics the p-value or probability value is the probability of obtaining the test results as…
Q: Which statement describes a difference between sample standard deviation (SD) and the standard error…
A: The idea of standard deviation was introduced by Karl Pearson in the year 1893. Standard Deviation…
Q: It is never necessary to take more than one composite sample per field. Group of answer choices…
A: False. Composite samples is made by mixing more than two samples taken from the same site from…
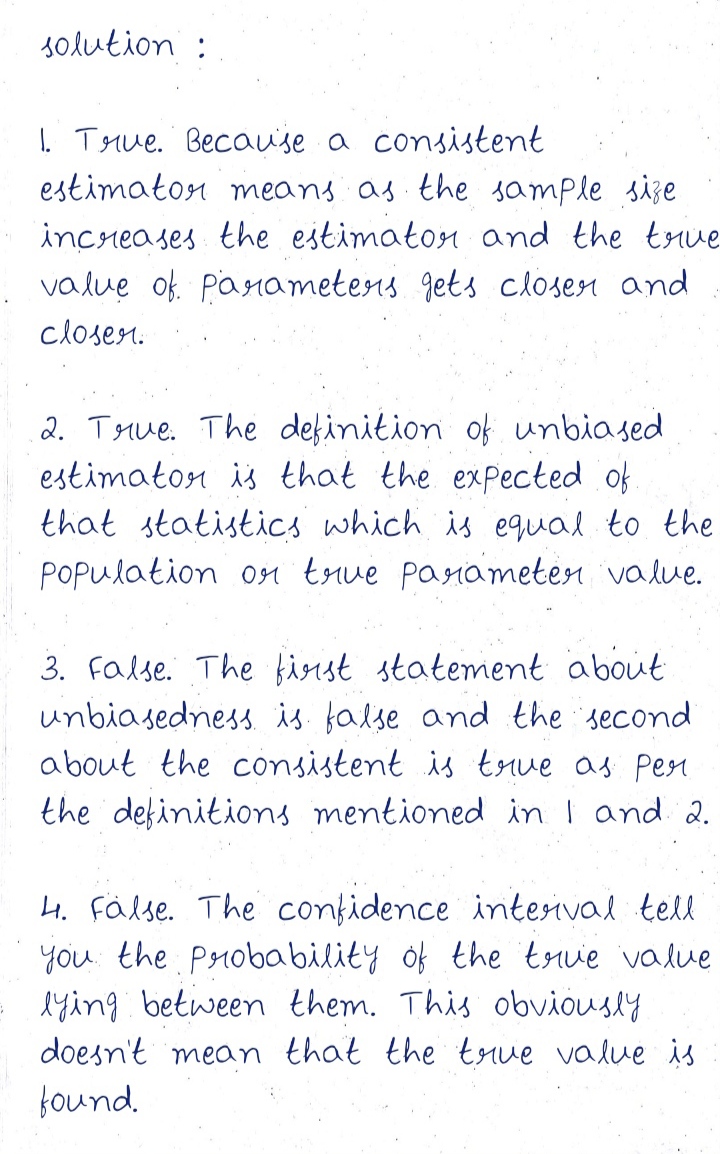
The following statements are either true or false. Indicate true or false and justify your answer briefly.
- An unbiased estimator is said to be consistent if the difference between the estimator and the population parameter grows smaller as the sample size grows larger.
- An unbiased estimator is a sample statistic whose expected value equals the population parameter.
- Knowing that an estimator is unbiased neither assures us that its expected value equals the population parameter, nor does it tell us how close the estimator is to the population parameter.
-
A specific confidence interval obtained from sample data will always correctly estimate the population parameter.


Trending now
This is a popular solution!

Step by step
Solved in 2 steps with 4 images


- Suppose that you are interested in estimating a population mean. You select a random sample of items, and compute the sample mean and the sample standard deviation. You then compute a 95% confidence interval to be LCL=28.4 - UCL=37.9. So what does that mean? It means that you are 95% confident that the unknown population mean that you are estimating is between the LCL and UCL. So what does that mean? It means that if you were to iterate this sampling process many times, say 100, and calculate 100 confidence intervals, then 95 of those intervals will contain the unknown population mean, and 5 will not. Give me an example of how CI can be used in your work. FYI I work in Endocrinology dept. Specific diabetesA Researcher decided to put students into groups based on their Cumulative Weighted Averages and had four different groups. He then systematically selected one student from each group and assigned some clear roles and responsibilities. Here, the researcher used ……………………..in selecting the students. a.Simple random samplingb.Cluster random samplingc.Stratified random samplingd.Two stage cluster samplinge.Convenience sampling In a short sentence each, explain THREE of the sampling types indicated in the options aboveSelect ant article, and provide a reference link so your article can be accessed. (any)Read the article and provide a summary of the article and any research done. 2-3 paragraphs will be sufficient. Look at the statistics used in the article. What was the research question (hypothesis)? What parameter would be of interest in this study (population mean, population proportion, population standard deviation, etc.) What was the statistical test run in the analysis? (Did they run a regression analysis, Z-test, T-test, ANOVA, etc.) Write 2-3 paragraphs on this. Reflect on why you chose the article and its applicability to nursing practice. I was helped with this but it was on my old account please help again.
- A Researcher decided to put students into groups based on their Cumulative Weighted Averages and had four different groups. He then systematically selected one student from each group and assigned some clear roles and responsibilities. Here, the researcher used ……………………..in selecting the students. In a short sentence each, explain THREE of the sampling typesBriefly explain the rationale for deciding on sample size for a population study. Identify Three probability sampling techniques that may be employed for data collection purposes and write briefly on any one of your choice.If possible please answer all four questions. For each hypothesis, identify the independent and dependent variable. Also, decide on an appropriate control group and form of data. Thank you.
- How would I number it on the graph to put the averages on thereWhen a correlational study demonstrates a relationship between two variables, it allows researchers to use knowledge about one variable to ______________ the second variable. Describe how the third-variable problem and the directionality problem limit the interpretation of results from correlational research designs and support that a correlational study may establish that two variables are related, it does not mean that there must be a direct relationship between the two variables.Which is the correct equation for the chisquare statistic? Group of answer choices a)x^2 = [(observed-expected)^2]/expected b)x^2 = sum[((observed-expected)^2)/observed] c)x^2 = sum[((observed-expected)^2)/expected] d)x^2 = sum[(observed-expected)/expected] What is a "p-value"? Group of answer choices a)the threshold at which you will reject the null hypothesis b)the probability of the null hypothesis being false c)the percentage of days you are sick during the year d)the probability of the null hypothesis being true
- Provide an example of a research project in your hometown where you would choose to use a t-test for independent samples. Would you use a one-tail or two-tail test, and why? What is your null hypothesis and research hypothesis? If you have a sample size of 500, should you interpret the statistical significance or the effect size?In your own words describe why we should use both samples to estimate the variance of the population when working with an independent two-sample design?What is the value of a random sample? Will random sampling always ensure that a sample is representative of a population? Explain your answer.