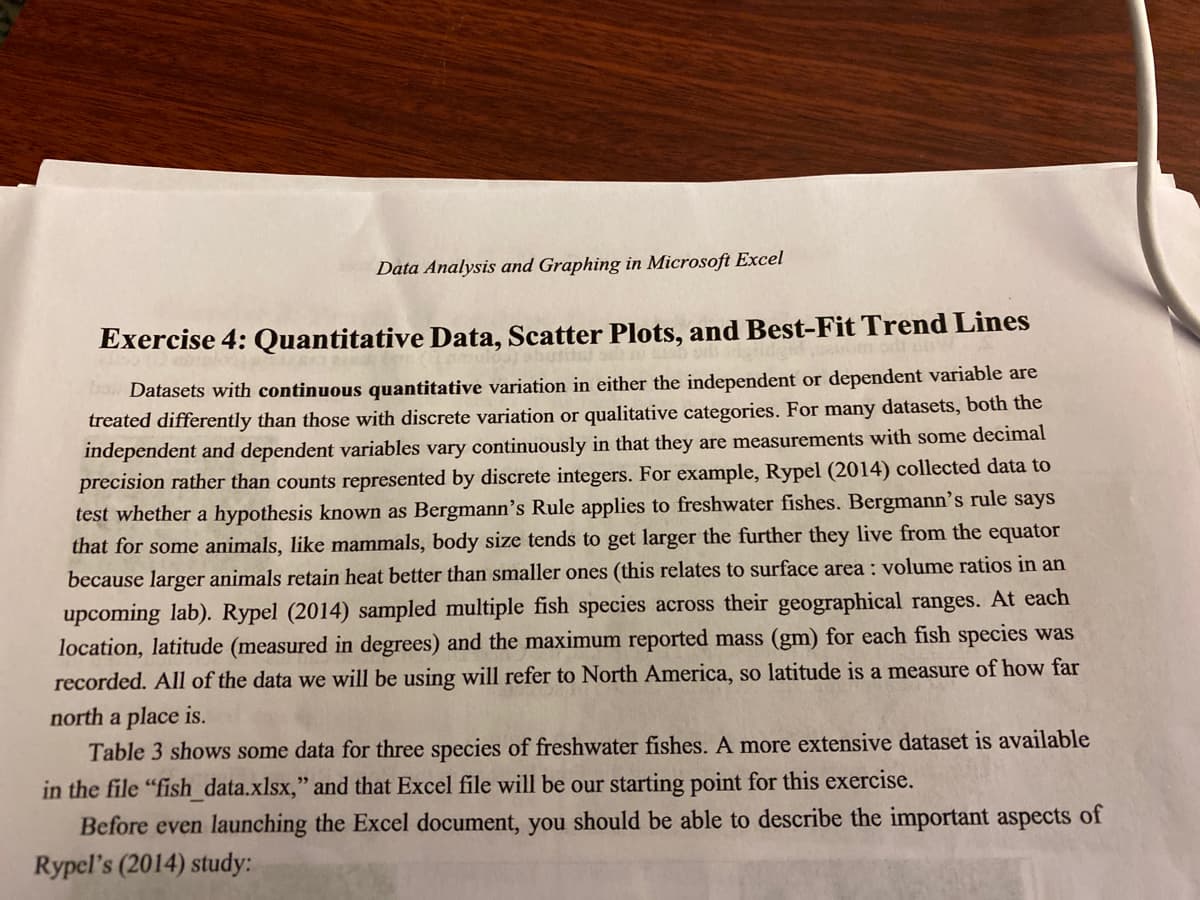
Data Analysis and Graphing in Microsoft Excel Exercise 4: Quantitative Data, Scatter Plots, and Best-Fit Trend Lines Datasets with continuous quantitative variation in either the independent or dependent variable are treated differently than those with discrete variation or qualitative categories. For many datasets, both the independent and dependent variables vary continuously in that they are measurements with some decimal precision rather than counts represented by discrete integers. For example, Rypel (2014) collected data to test whether a hypothesis known as Bergmann's Rule applies to freshwater fishes. Bergmann's rule says that for some animals, like mammals, body size tends to get larger the further they live from the equator because larger animals retain heat better than smaller ones (this relates to surface area : volume ratios in an upcoming lab). Rypel (2014) sampled multiple fish species across their geographical ranges. At each location, latitude (measured in degrees) and the maximum reported mass (gm) for each fish species was recorded. All of the data we will be using will refer to North America, so latitude is a measure of how far north a place is. Table 3 shows some data for three species of freshwater fishes. A more extensive dataset is available in the file "fish data.xlsx," and that Excel file will be our starting point for this exercise. Before even launching the Excel document, you should be able to describe the important aspects of Rypel's (2014) study:
Data Analysis and Graphing in Microsoft Excel Exercise 4: Quantitative Data, Scatter Plots, and Best-Fit Trend Lines Datasets with continuous quantitative variation in either the independent or dependent variable are treated differently than those with discrete variation or qualitative categories. For many datasets, both the independent and dependent variables vary continuously in that they are measurements with some decimal precision rather than counts represented by discrete integers. For example, Rypel (2014) collected data to test whether a hypothesis known as Bergmann's Rule applies to freshwater fishes. Bergmann's rule says that for some animals, like mammals, body size tends to get larger the further they live from the equator because larger animals retain heat better than smaller ones (this relates to surface area : volume ratios in an upcoming lab). Rypel (2014) sampled multiple fish species across their geographical ranges. At each location, latitude (measured in degrees) and the maximum reported mass (gm) for each fish species was recorded. All of the data we will be using will refer to North America, so latitude is a measure of how far north a place is. Table 3 shows some data for three species of freshwater fishes. A more extensive dataset is available in the file "fish data.xlsx," and that Excel file will be our starting point for this exercise. Before even launching the Excel document, you should be able to describe the important aspects of Rypel's (2014) study:

Case Studies In Health Information Management
3rd Edition
ISBN:9781337676908
Author:SCHNERING
Publisher:SCHNERING
Chapter7: Healthcare Statistics And Research Methods
Section: Chapter Questions
Problem 7.3.5C

Related questions

Question
What is the independent and dependent variable here I am stuck
Transcribed Image Text:Data Analysis and Graphing in Microsoft Excel
Exercise 4: Quantitative Data, Scatter Plots, and Best-Fit Trend Lines
Datasets with continuous quantitative variation in either the independent or dependent variable are
treated differently than those with discrete variation or qualitative categories. For many datasets, both the
independent and dependent variables vary continuously in that they are measurements with some decimal
precision rather than counts represented by discrete integers. For example, Rypel (2014) collected data to
test whether a hypothesis known as Bergmann's Rule applies to freshwater fishes. Bergmann's rule says
that for some animals, like mammals, body size tends to get larger the further they live from the equator
because larger animals retain heat better than smaller ones (this relates to surface area : volume ratios in an
upcoming lab). Rypel (2014) sampled multiple fish species across their geographical ranges. At each
location, latitude (measured in degrees) and the maximum reported mass (gm) for each fish species was
recorded. All of the data we will be using will refer to North America, so latitude is a measure of how far
north a place is.
Table 3 shows some data for three species of freshwater fishes. A more extensive dataset is available
in the file "fish data.xlsx," and that Excel file will be our starting point for this exercise.
Before even launching the Excel document, you should be able to describe the important aspects of
Rypel's (2014) study:
Expert Solution
This question has been solved!
Explore an expertly crafted, step-by-step solution for a thorough understanding of key concepts.

This is a popular solution!

Trending now
This is a popular solution!

Step by step
Solved in 3 steps

Knowledge Booster


Learn more about
Need a deep-dive on the concept behind this application? Look no further. Learn more about this topic, biology and related others by exploring similar questions and additional content below.Recommended textbooks for you
Case Studies In Health Information Management
Biology
ISBN:
9781337676908
Author:
SCHNERING
Publisher:
Cengage
Essentials Health Info Management Principles/Prac…
Health & Nutrition
ISBN:
9780357191651
Author:
Bowie
Publisher:
Cengage
Case Studies In Health Information Management
Biology
ISBN:
9781337676908
Author:
SCHNERING
Publisher:
Cengage
Essentials Health Info Management Principles/Prac…
Health & Nutrition
ISBN:
9780357191651
Author:
Bowie
Publisher:
Cengage