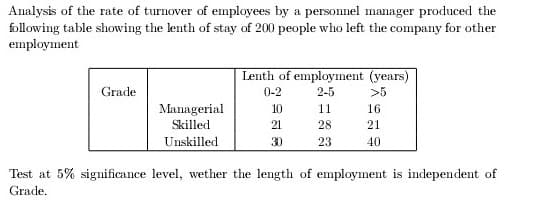
Analysis of the rate of turnover of employees by a personnel manager produced the following table showing the lenth of stay of 200 people who left the company for other employment Grade Managerial Skilled Unskilled Lenth of employment (years) 0-2 2-5 >5 10 21 30 11 28 23 16 21 40 Test at 5% significance level, wether the length of employment is independent of Grade.


Q: A popular Italian eatery has had a dispute among the wait staff regarding the amount of tips waiters…
A: Lunch:Sample size Sample mean Sample standard deviation Dinner:Sample size Sample mean Sample…
Q: Last year's average beef consumption was 56.2 lb. This year, a random sample of 100 consumers showed…
A: Given:n = 100x̄ = 58.4s = 16.8
Q: What is the shape of the distribution for the following set of data? X f 54321 1 2 4 1 5
A: Here the given set of data,Xf1524324151
Q: Let's say we want to do a 2 sample t-test and we want to know if the difference between groups 1 and…
A: Let's say we want to do a two sample t-test and we want to know if the difference between groups 1…
Q: A quality manager believes there may be a relationship between the experience level of an inspector…
A: The question is about hypothesis testingGiven :To find :a ) Hypotheses for the testb ) Test…
Q: A real estate company is interested in the ages of home buyers. They examined the ages of thousands…
A: From the provided information,Mean (µ) = 48Standard deviation ( ) = 10Here X is a random variable…
Q: Please no written by hand solution Imagine you're observing a particular bird species and you…
A: instead of 50 days of observation, you only observed for 200 days then how the confidence interval…
Q: An employment information service claims the mean annual salary for senior level product engineers…
A: let's set up the null hypothesis and alternative hypothesis Null hypothesis: the population mean is…
Q: What is the distribution of X? X ~ N( ? , ? ) b. What is the median giraffe height? ft.…
A: Let X be the random variable the height of an adult giraffe.Given that,Population mean Population…
Q: Use the frequency distribution shown below to construct an expanded frequency distribution. High…
A: The table shows the frequency distribution of high temperatures.
Q: Consider the information above and in question 1. It is conjectured that the mean number of people…
A: It is conjectured that the mean number of people attending all 2017 Veterans Day celebrations is…
Q: The average life of light bulbs produced by SABA Electric Co. is expected to be normally distributed…
A: The average life of light bulbs produced by SABA Electric Co. is expected to be normally distributed…
Q: Construct a 99% confidence interval of the population proportion using the given information. x =…
A: X=175n=250
Q: (a) Find the 32nd percentile: P32 = (b) Find the 79th percentile: P79= (c) Find the percentile for…
A: 110, 120, 150, 160, 180, 190, 210, 220, 240, 250, 270, 280, 330, 350, 360, 380, 420, 460, 470, 490,…
Q: An employment information service claims the mean annual salary for senior level product engineers…
A: Answer Given…
Q: For the normal probability plot shown below, the correlation between the random variable X and…
A: Given that The correlation between X and expected z score is 0.889n= 15 sample size
Q: Here are summary statistics for the weights of Pepsi in randomly selected cans: n=36, x=0.82408…
A: sample size(n)=36Mean()=0.82408standard deviation(s)=0.00568Confidence level=90%
Q: With the data below, prepare a boxplot (summary of five (5) numbers): 114, 90, 123, 98, 78, 118,…
A: To prepare a box plot (also known as a box-and-whisker plot) for the given data, we first need to…
Q: 1. Let K be a geometric random variable having probability mass function P(K = k)= (1-2)k-¹a, 0 k₁ ≥…
A: Given be a geometric random variable having probability mass function :
Q: The average American man consumes 9.8 grams of sodium each day. Suppose that the sodium consumption…
A: Population mean=9.8 Standard deviation =1a..What is the distribution of Xb. Find the probability…
Q: A sample consists of n = 16 scores. How many of the scores are used to calculate the range? Question…
A: From the provided information,Sample size (n) = 16
Q: Let X1, X₂, ..., Xn be a random sample from a normal distribution with unknown meanu and known…
A: Solution :Confidence interval for µ when the population is normal and the population variance is…
Q: A physical therapist claims that one 600-milligram dose of Vitamin C will increase muscular…
A: The question is about hypothesis testingGiven :No. of males selected ( n ) = 15To find :Is there…
Q: The standard deviation for the sample of five perfumed hands was 12.052%. Conduct the 5 steps of…
A: Let be the population mean.Given that,Population mean Sample size Sample mean Sample standard…
Q: uestion 2) Use EXS, with α = 0.8, to forecast the revenue in Year 6. Use Excel to forecast. Year
A: Given that,Forecasting constant To find the forecast in Year 6 using Exponential smoothing.
Q: K The test statistic of z=-1.45 is obtained when testing the claim that ps: This is a left-tailed…
A: Test statistics, The claim is
Q: An engineer has designed a valve that will regulate water pressure on an automobile engine. The…
A: From the provided information,Sample size (n) = 7Sample mean (x̄) = 7.0Sample standard deviation (s)…
Q: A pizza parlor offers 14 toppings. a. How many 4-topping pizzas could they put on their menu? Assume…
A:
Q: Find the first and third quartiles for the temperatures for a week in the summer of last year,…
A: Note:- "Since you have posted multiple questions, we will provide the solution only to the first…
Q: The accompanying data file shows the square footage and associated property taxes for 20 homes.…
A: Property…
Q: 3. A researcher begins with a sample of 60 subjects and randomly assigns 12 to each of 5 treatment…
A: a) To test whether the researcher's predictions are supported, we need to compare the means of Group…
Q: 3. A manufacturer of electronics will not accept a shipment of parts from a vendor if there is…
A:
Q: 1. Use the change of variables theorem to show that the probability density function of the…
A: A lognormal (log-normal or Galton) distribution is a probability distribution with a normally…
Q: Find the critical value(s) and rejection region(s) for the indicated t-test, level of significance…
A: Test is Left-tailed testn=13
Q: The unemployment rate in a city is 13%. If 10 people from the city are sampled at random, find the…
A: From the given information ,n = 10 P = 13% = 0.13Then ,q = 1 - p = 1 - 0.13 = 0.87Using formula ,(…
Q: There are three main brands of certain powder. A set of its 120 sales is examined and found to be…
A: The ANOVA (Analysis of variance) test compares the means of different samples and the significance…
Q: Suppose a researcher wants to test to see if there is a difference in the mean weights of male and…
A: MenWomen10.410.612.610.211.18.814.79.610.89.512.99.511.710.113.311.212.89.314.59.410.39.59.810.311Si…
Q: Consider the R output listed below. With this information, answer the following: model.fit =…
A: Coefficients:ar1intercept0.4796179.4921S.E0.05650.4268Sigma 2 estimated as 6.495: log likelihood = -…
Q: Let p be the population proportion for the following condition. Find the point estimates for p and…
A:
Q: A personnel director in a particular state claims that the mean annual income is the same in one of…
A: Hypothesis testing is a tool for making statistical inferences about the population data. It is an…
Q: Please do not give solution in image format thanku Load "diabetes" datasets from SKlearn and do the…
A: 1import numpy as np 2import matplotlib.pyplot as plt 3from sklearn.datasets import load_diabetes…
Q: Find the critical value to for the confidence level c = 0.99 and sample size n = 10. 11 Click the…
A: Given data in the problem isConfidence level c=0.99Sample size n=10We have to find critical value…
Q: In the value 80,80,10,25,65,100,200.What is the median and show me computation?
A: the data are : 80,80,10,25,65,100,200Number of data : n = 7Arrange data in accending order :…
Q: struct the confidence interval for the population mean μ. c=0.95, x= 9.3, o=0.6, and n = 43 %…
A: According to the given information in this question, we need to construct 95 % confidence interval
Q: A magazine provided results from a poll of 2000 adults who were asked to identify their favorite…
A: Sample proportion=0.13Sample size=2000Margin of error=0.03
Q: To test Ho: H=40 versus H₁: μ<40, a random sample of size n = 22 is obtained from a population that…
A: From the provided information,H0: µ = 40H1: µ < 40Sample size (n) = 22Sample mean (x̄) =…
Q: As part of a weight reduction program, a man designs a monthly exercise program consisting of…
A: Optimizationin this question, we need to divide the number of hours available amongst the three…
Q: Given the frequency table below, what is the relative frequency of the data value 7?…
A: ValueFrequency47566473
Q: Use the given statement to represent a claim. Write its complement and state which is Ho and which…
A: Claim: The population mean (μ) is greater than or equal to 690.
Q: If you roll two dice and record their sum, the events “even” and “less than or equal to 6” are:…
A: We have to check the independence of 2 events.

Step by step
Solved in 6 steps with 8 images

- A suburban hotel derives its revenue from its hotel and restaurant operations. Theowners are interested in the relationship between the number of rooms occupied on anightly basis and the revenue per day in the restaurant. Below is a sample of 25 days(Monday through Thursday) from last year showing the restaurant income and numberof rooms occupied.Let X denote the courtship time for a randomly selected female-malepair of mating scorpion flies (time from the beginning of interactionuntil mating). Suppose the mean value of X is 120 min and the standarddeviation of Xis 110 min (suggested by data in the article "Should I Stayor Should I Go? Condition- and Status-Dependent Courtship Decisions inthe Scorpion Fly Panorpa Cognate"(Animal Behavior, 2009: 491-497)). a. Is it plausible that X is normally distributed?b. For a random sample of 50 such pairs, what is the (approximate)probability that the sample mean courtship time is between 100min and 125 min? c. For a random sample of 50 such pairs, what is the (approximate)probability that the total courtship time exceeds 150 hr?d. Could the probability requested in (b) be calculated from thegiven information if the sample size were 15 rather than 50?Explain.A researcher is interested in studying the effects of altitude on cognitive performance (e.g., perception, memory, problem solving, etc.). The researcher finds a group of experienced mountain climbers (n = 10) who volunteer to participate in the study. All of the climbers are tested at three different altitudes—at sea level (in the researchers’ laboratory at the University of California, San Diego), at the base camp (9,000 feet above sea level), and at 23,000 feet above sea level (at the peak of Mt. Denali in Alaska). At each location, the climbers perform a memory task (remember a list of 16 non-words like “biv”), and the accuracy of their memory is recorded (i.e., # of correctly recalled words). a. pls name the independent variable, dependent variable, levels of the IV, and the type of experiment design of this study (i.e., b/w- or w/i-subject design ) b. on what level of measurement is accuracy of memory assessed? (i.e., is it on nominal, ordinal, interval, or ratio?
- A researcher is interested in studying the effects of altitude on cognitive performance (e.g., perception, memory, problem solving, etc.). The researcher finds a group of experienced mountain climbers (n = 10) who volunteer to participate in the study. All of the climbers are tested at three different altitudes—at sea level (in the researchers’ laboratory at the University of California, San Diego), at the base camp (9,000 feet above sea level), and at 23,000 feet above sea level (at the peak of Mt. Denali in Alaska). At each location, the climbers perform a memory task (remember a list of 16 non-words like “biv”), and the accuracy of their memory is recorded (i.e., # of correctly recalled words). a. pls name the independent variable, dependent variable, levels of the IV, and the type of experiment design of this study (i.e., b/w- or w/i-subject design ) b. on what level of measurement is accuracy of memory assessed? (i.e., is it on nominal, ordinal, interval, or ratio?) View…A sample of 100 mortgages approved during the current year showed that 31 were issued to a single-earner family or individual. The historical percentage is 25 percent. At the .05 level of significance in a right-tailed test, has the percentage of single-earner or individual mortgages risen? (a-1) H0: π ≤ .25 versus H1: π > .25. Choose the right option. Reject H0 if zcalc > 1.645 Reject H0 if zcalc < 1.645 a b Calculate the test statistic. (Round your answer to 4 decimal places.)A study was made of 1,057 cases of poisoning in children treated as inpatients at Milwaukee Children's Hospital from 1962 through 1968. Data on date of occurrence, age and sex of the child, and type of agent involved were recorded and analyzed by standard statistical methods. Poisoning was due to ingestion of aspirin in 35 per cent of the children studied and to the ingestion of hydrocarbon distillates in 18 per cent. A statistically significant male dominance was found for ingestion of hydrocarbons; age-specific peaks were found for some categories. Trends as to the relative and absolute frequencies of each specific poison from one year to the next were noted; possible reasons for increasing or decreasing trends are discussed. Is this study descriptive or inferential? Explain your answer. What are the variables used in the study? In your opinion, what level of measurement was used to obtain the data from the variables? Does the article define the population? If so, how is it…
- Compute the symmetric 95% interval estimate for the mean of the quartz monzonite data.Compute the sample mean and the mean assuming the data are lognormal. Which point estimateis more appropriate for these data? Why?Chloride concentration, in mg/LQuartz Monzonite 1.0 0.2 1.2 1.0 0.3 0.10.1 0.4 3.2 0.3 0.4 1.80.9 0.1 0.2 0.3 0.5Water availability is of prime importance in the life cycle of most reptiles. To determine the rate of evaporative water loss of a certain species of lizard at a particular desert site, 34 such lizards were randomly collected, weighed and placed under the appropriate experimental conditions. After 24 hours, each lizard was removed, weighed, and its total water loss was calculated by subtracting its body weight after treatment from its initial body weight. Previous studies have shown that the relative frequency distribution of water loss for this species of lizard has a mean of 3.1 grams and a s.d. of 0.8 gram b) What is the probability that x is less than 2.7 grams?Cell Phones and Cancer In a study of 420,095 Danish cell phone users, 135 subjects developed cancer of the brain or nervous system (based on data from theJournal of the National Cancer Institute as reported in USA Today).Test the claim of a somewhat common belief that such cancers are affected by cell phone use. That is, test the claim that cell phone users develop cancer of the brain or nervous system at a rate that is different from the rate of 0.0340% for people who do not use cell phones. Because this issue has such great importance, use a 0.005 significance level. Based on these results, should cell phone users be concerned about cancer of the brain or nervous system?
- Test the hypothesis that the average content of containers of a particular machine oil is 10 liters, if the contents of random sample of 10 containers are: 10.1, 9.3, 9.7, 10.2, 10.1, 9.9, 9.5, 10.2, 9.8, and 10.1. Use 0.01 level of significance. Assume to be normally distributed data.A researcher has observed 500 vehicles at a stop sign in a suburban neighbourhood and recorded the type of vehicle (sedan, hatchback, bakkie) and driver behaviour at the stop sign (complete stop, near stop, “ran” the stop sign). At the 0.05 level of significance, could there be some relationship between driver behaviour and the type of vehicle being driven? Define the null hypothesis and the alternative hypothesis. A. H1: Driver’s behaviour and type of vehicle are independent vs H0: A relationship exists between driver’s behaviour and type of vehicle B. H0: A relationship exists between driver’s behaviour and type of vehicle vs H1: No relationship exists between driver’s behaviour and type of vehicle C. H0: Driver’s behaviour and dependent on the type of vehicle vs H1: Driver’s behaviour and type of vehicle are independent D. H0: Driver’s behaviour and type of vehicle are independent vs H1: A relationship exists between driver’s behaviour and type of vehicle