Analytics Exercise 18-1 (Algo) Starbucks has a large, global supply chain that must efficiently supply over 17,000 stores. Although the stores might appear to be very similar, they are actually very different. Depending on the location of the store, its size, and the profile of the customers served, Starbucks management configures the store offerings to take maximum advantage of the space available and customer preferences. Starbucks' actual distribution system is much more complex, but for the purpose of our exercise let's focus on a single item that is currently distributed through five distribution centers in the United States. Our item is a logo-branded coffeemaker that is sold at some of the larger retail stores. The coffeemaker has been a steady seller over the years due to its reliability and rugged construction. Starbucks does not consider this a seasonal product, but there is some variability in demand. Demand for the product over the past 13 weeks is shown in the following table. (week-1 is the week before week 1 in the table, -2 is two weeks before week 1, etc.). Management would like you to experiment with some forecasting models to determine what should be used in a new system to be implemented. The new system is programmed to use one of two forecasting models: simple moving average or exponential smoothing. 47 50 49 69 WEEK -5 -4 -3 -2 -1 1 2 3 4 5 6 Atlanta 45 32 34 55 32 32 46 35 33 55 28 Boston 56 27 47 43 35 32 35 44 45 45 Chicago 50 20 64 40 40 45 33 26 Dallas 36 35 34 60 42 29 28 35 LA 41 40 48 40 35 36 42 44 228 154 227 238 184 174 184 184 212 242 272 247 203 217 255 171 232 232 38 48 62 45 66 42 35 46 Total 13 7 8 9 10 11 12 20 58 45 35 26 57 42 52 18 62 43 31 41 51 65 30 24 95 34 44 46 68 62 47 40 35 40 43 39 42 45 50 50 a. Consider using a simple moving average model. Experiment with models using five weeks' and three weeks' past data. (Round your answers to 2 decimal places.)
Analytics Exercise 18-1 (Algo) Starbucks has a large, global supply chain that must efficiently supply over 17,000 stores. Although the stores might appear to be very similar, they are actually very different. Depending on the location of the store, its size, and the profile of the customers served, Starbucks management configures the store offerings to take maximum advantage of the space available and customer preferences. Starbucks' actual distribution system is much more complex, but for the purpose of our exercise let's focus on a single item that is currently distributed through five distribution centers in the United States. Our item is a logo-branded coffeemaker that is sold at some of the larger retail stores. The coffeemaker has been a steady seller over the years due to its reliability and rugged construction. Starbucks does not consider this a seasonal product, but there is some variability in demand. Demand for the product over the past 13 weeks is shown in the following table. (week-1 is the week before week 1 in the table, -2 is two weeks before week 1, etc.). Management would like you to experiment with some forecasting models to determine what should be used in a new system to be implemented. The new system is programmed to use one of two forecasting models: simple moving average or exponential smoothing. 47 50 49 69 WEEK -5 -4 -3 -2 -1 1 2 3 4 5 6 Atlanta 45 32 34 55 32 32 46 35 33 55 28 Boston 56 27 47 43 35 32 35 44 45 45 Chicago 50 20 64 40 40 45 33 26 Dallas 36 35 34 60 42 29 28 35 LA 41 40 48 40 35 36 42 44 228 154 227 238 184 174 184 184 212 242 272 247 203 217 255 171 232 232 38 48 62 45 66 42 35 46 Total 13 7 8 9 10 11 12 20 58 45 35 26 57 42 52 18 62 43 31 41 51 65 30 24 95 34 44 46 68 62 47 40 35 40 43 39 42 45 50 50 a. Consider using a simple moving average model. Experiment with models using five weeks' and three weeks' past data. (Round your answers to 2 decimal places.)

Practical Management Science
6th Edition
ISBN:9781337406659
Author:WINSTON, Wayne L.
Publisher:WINSTON, Wayne L.
Chapter2: Introduction To Spreadsheet Modeling
Section: Chapter Questions
Problem 20P: Julie James is opening a lemonade stand. She believes the fixed cost per week of running the stand...

Related questions
Question
Heres a zoom in photo of of the problem/ Please solve
Transcribed Image Text:Analytics Exercise 18-1 (Algo)
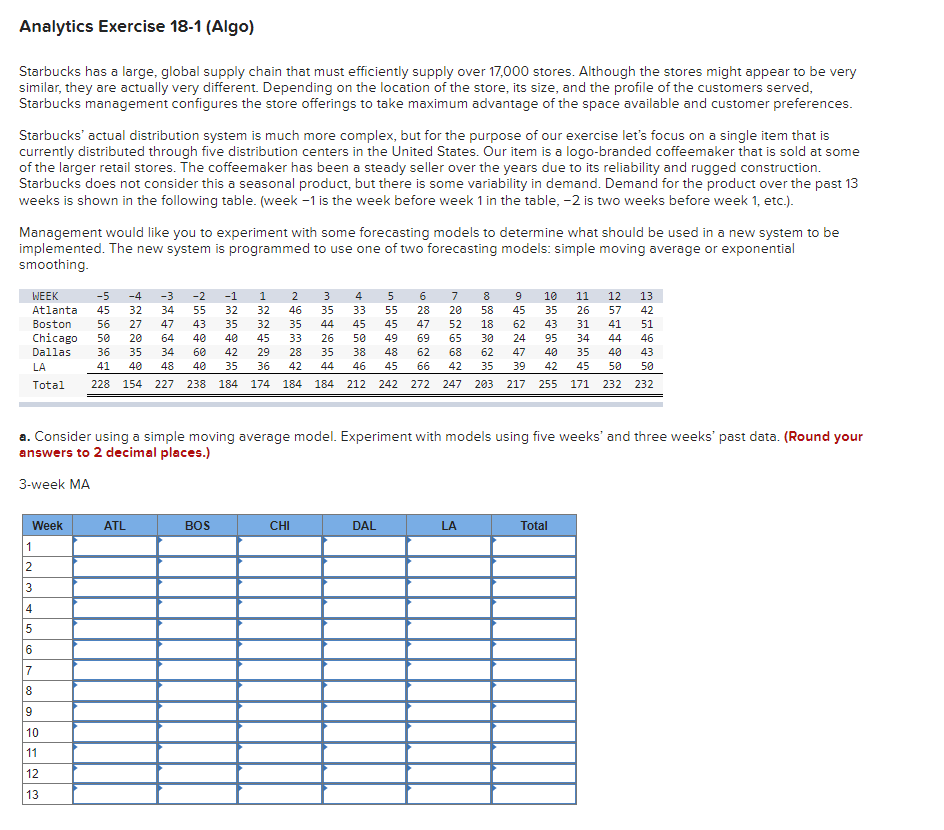
Starbucks has a large, global supply chain that must efficiently supply over 17,000 stores. Although the stores might appear to be very
similar, they are actually very different. Depending on the location of the store, its size, and the profile of the customers served,
Starbucks management configures the store offerings to take maximum advantage of the space available and customer preferences.
Starbucks' actual distribution system is much more complex, but for the purpose of our exercise let's focus on a single item that is
currently distributed through five distribution centers in the United States. Our item is a logo-branded coffeemaker that is sold at some
of the larger retail stores. The coffeemaker has been a steady seller over the years due to its reliability and rugged construction.
Starbucks does not consider this a seasonal product, but there is some variability in demand. Demand for the product over the past 13
weeks is shown in the following table. (week -1 is the week before week 1 in the table, -2 is two weeks before week 1, etc.).
Management would like you to experiment with some forecasting models to determine what should be used in a new system to be
implemented. The new system is programmed to use one of two forecasting models: simple moving average or exponential
smoothing.
WEEK
-5 -4 -3 -2
Atlanta 45 32 34
Boston 56 27 47
Chicago 50 20 64
Dallas 36 35 34
LA
41 40 48
Total
Week
1
2
3
4
5
2 55 3 40 60 40
6
7
8
9
10
11
12
13
43
228 154 227 238
ATL
-1 1 2 3
32
32 46 35
35 32 35 44
40 45
33 26 50
42 29 28 35
BOS
48
45 58 8 45
5 5 45 49 48 45
33
38
35 36 42 44 46
CHI
6
55 28 20
47 52
69 65
62
68
62
42 35
7 8
66
DAL
58
18
LA
30
45 2 24 47 39
10 35 45 95 48 42
9
62
184 174 184 184 212 242 272 247 203 217 255
40
43 31 41
42
11 12 13
42
a. Consider using a simple moving average model. Experiment with models using five weeks' and three weeks' past data. (Round your
answers to 2 decimal places.)
3-week MA
26 57
Total
34 44
35 45
40 50
171 232
51
46
43
50
232
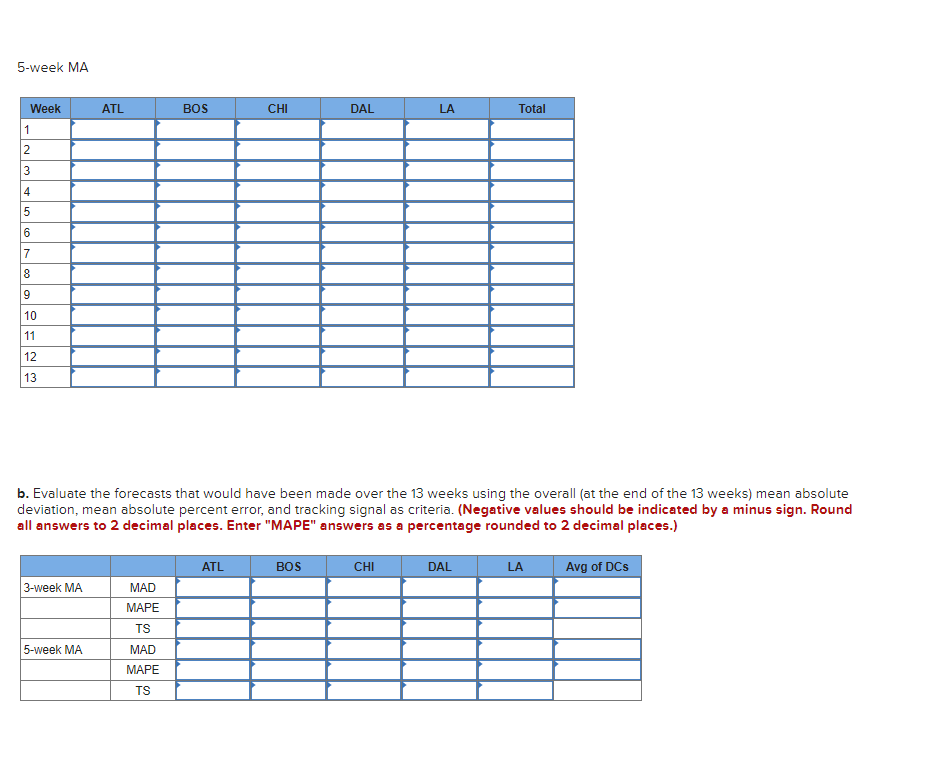
Transcribed Image Text:5-week MA
Week
1
2
3
4
5
6
7
8
9
10
11
12
13
3-week MA
ATL
5-week MA
MAD
MAPE
TS
BOS
MAD
MAPE
TS
b. Evaluate the forecasts that would have been made over the 13 weeks using the overall (at the end of the 13 weeks) mean absolute
deviation, mean absolute percent error, and tracking signal as criteria. (Negative values should be indicated by a minus sign. Round
all answers to 2 decimal places. Enter "MAPE" answers as a percentage rounded to 2 decimal places.)
CHI
ATL
DAL
BOS
LA
CHI
Total
DAL
LA
Avg of DCs
Expert Solution
This question has been solved!
Explore an expertly crafted, step-by-step solution for a thorough understanding of key concepts.

This is a popular solution!

Trending now
This is a popular solution!

Step by step
Solved in 4 steps with 8 images

Recommended textbooks for you
Practical Management Science
Operations Management
ISBN:
9781337406659
Author:
WINSTON, Wayne L.
Publisher:
Cengage,

Operations Management
Operations Management
ISBN:
9781259667473
Author:
William J Stevenson
Publisher:
McGraw-Hill Education

Operations and Supply Chain Management (Mcgraw-hi…
Operations Management
ISBN:
9781259666100
Author:
F. Robert Jacobs, Richard B Chase
Publisher:
McGraw-Hill Education
Practical Management Science
Operations Management
ISBN:
9781337406659
Author:
WINSTON, Wayne L.
Publisher:
Cengage,
Operations Management
Operations Management
ISBN:
9781259667473
Author:
William J Stevenson
Publisher:
McGraw-Hill Education
Operations and Supply Chain Management (Mcgraw-hi…
Operations Management
ISBN:
9781259666100
Author:
F. Robert Jacobs, Richard B Chase
Publisher:
McGraw-Hill Education


Purchasing and Supply Chain Management
Operations Management
ISBN:
9781285869681
Author:
Robert M. Monczka, Robert B. Handfield, Larry C. Giunipero, James L. Patterson
Publisher:
Cengage Learning

Production and Operations Analysis, Seventh Editi…
Operations Management
ISBN:
9781478623069
Author:
Steven Nahmias, Tava Lennon Olsen
Publisher:
Waveland Press, Inc.