Analyze the financials for Wal-Mart and its competitor(s) in the online market in 2012 and 2016. What do you conclude from analyzing financial ratios about the companies strategies and Walmart's competitive advantage? Revenue Cost of goods sold Gross profit SG&A and other expenses Operating income Net income Total assets Total liabilities Total equity Total assets end Total assets beginning Total liabilities end Total liabilities beginning Total equity end Total equity beginning Cost of goods sold as % of sales Gross margin SG&A as % of sales Operating income margin Net profit margin Asset turnover ROA ROE Walmart 2012 in $ millions 443,854 335,127 108,727 85,265 23,462 15,699 186,931 113,021 73,910 193,406 180,455 117,241 108,800 76,165 71,655 75.5% 24.5% 19.2% 5.3% 3.5% 2.4 8.4% 21.2% Walmart 2016 in $ millions 478,614 360,984 117,630 97,041 20,589 14,694 201,536 116,762 84,774 199,581 203,490 115,970 117,553 83,611 85,937 75.4% 24.6% 20.3% 4.3% 3.1% 2.4 7.3% 17.3% Amazon 2012 in $ millions 61,093 45,971 15,122 14,287 835 (39) 28,903 20,928 7,975 32,555 25,250 24,363 17,493 8,192 7,757 75.2% 24.8% 23.4% 1.4% -0.1% 2.1 -0.1% -0.5% Amazon 2016 in $ millions 135,987 88,265 47,722 43,369 4,353 2,371 74,075 57,740 16,335 83,402 64,747 64,117 51,363 19,285 13,384 64.9% 35.1% 31.9% 3.2% 1.7% 1.8 3.2% 14.5%
Analyze the financials for Wal-Mart and its competitor(s) in the online market in 2012 and 2016. What do you conclude from analyzing financial ratios about the companies strategies and Walmart's competitive advantage? Revenue Cost of goods sold Gross profit SG&A and other expenses Operating income Net income Total assets Total liabilities Total equity Total assets end Total assets beginning Total liabilities end Total liabilities beginning Total equity end Total equity beginning Cost of goods sold as % of sales Gross margin SG&A as % of sales Operating income margin Net profit margin Asset turnover ROA ROE Walmart 2012 in $ millions 443,854 335,127 108,727 85,265 23,462 15,699 186,931 113,021 73,910 193,406 180,455 117,241 108,800 76,165 71,655 75.5% 24.5% 19.2% 5.3% 3.5% 2.4 8.4% 21.2% Walmart 2016 in $ millions 478,614 360,984 117,630 97,041 20,589 14,694 201,536 116,762 84,774 199,581 203,490 115,970 117,553 83,611 85,937 75.4% 24.6% 20.3% 4.3% 3.1% 2.4 7.3% 17.3% Amazon 2012 in $ millions 61,093 45,971 15,122 14,287 835 (39) 28,903 20,928 7,975 32,555 25,250 24,363 17,493 8,192 7,757 75.2% 24.8% 23.4% 1.4% -0.1% 2.1 -0.1% -0.5% Amazon 2016 in $ millions 135,987 88,265 47,722 43,369 4,353 2,371 74,075 57,740 16,335 83,402 64,747 64,117 51,363 19,285 13,384 64.9% 35.1% 31.9% 3.2% 1.7% 1.8 3.2% 14.5%

Chapter9: Projecting Financial Statements
Section: Chapter Questions
Problem 1aM

Related questions

Question
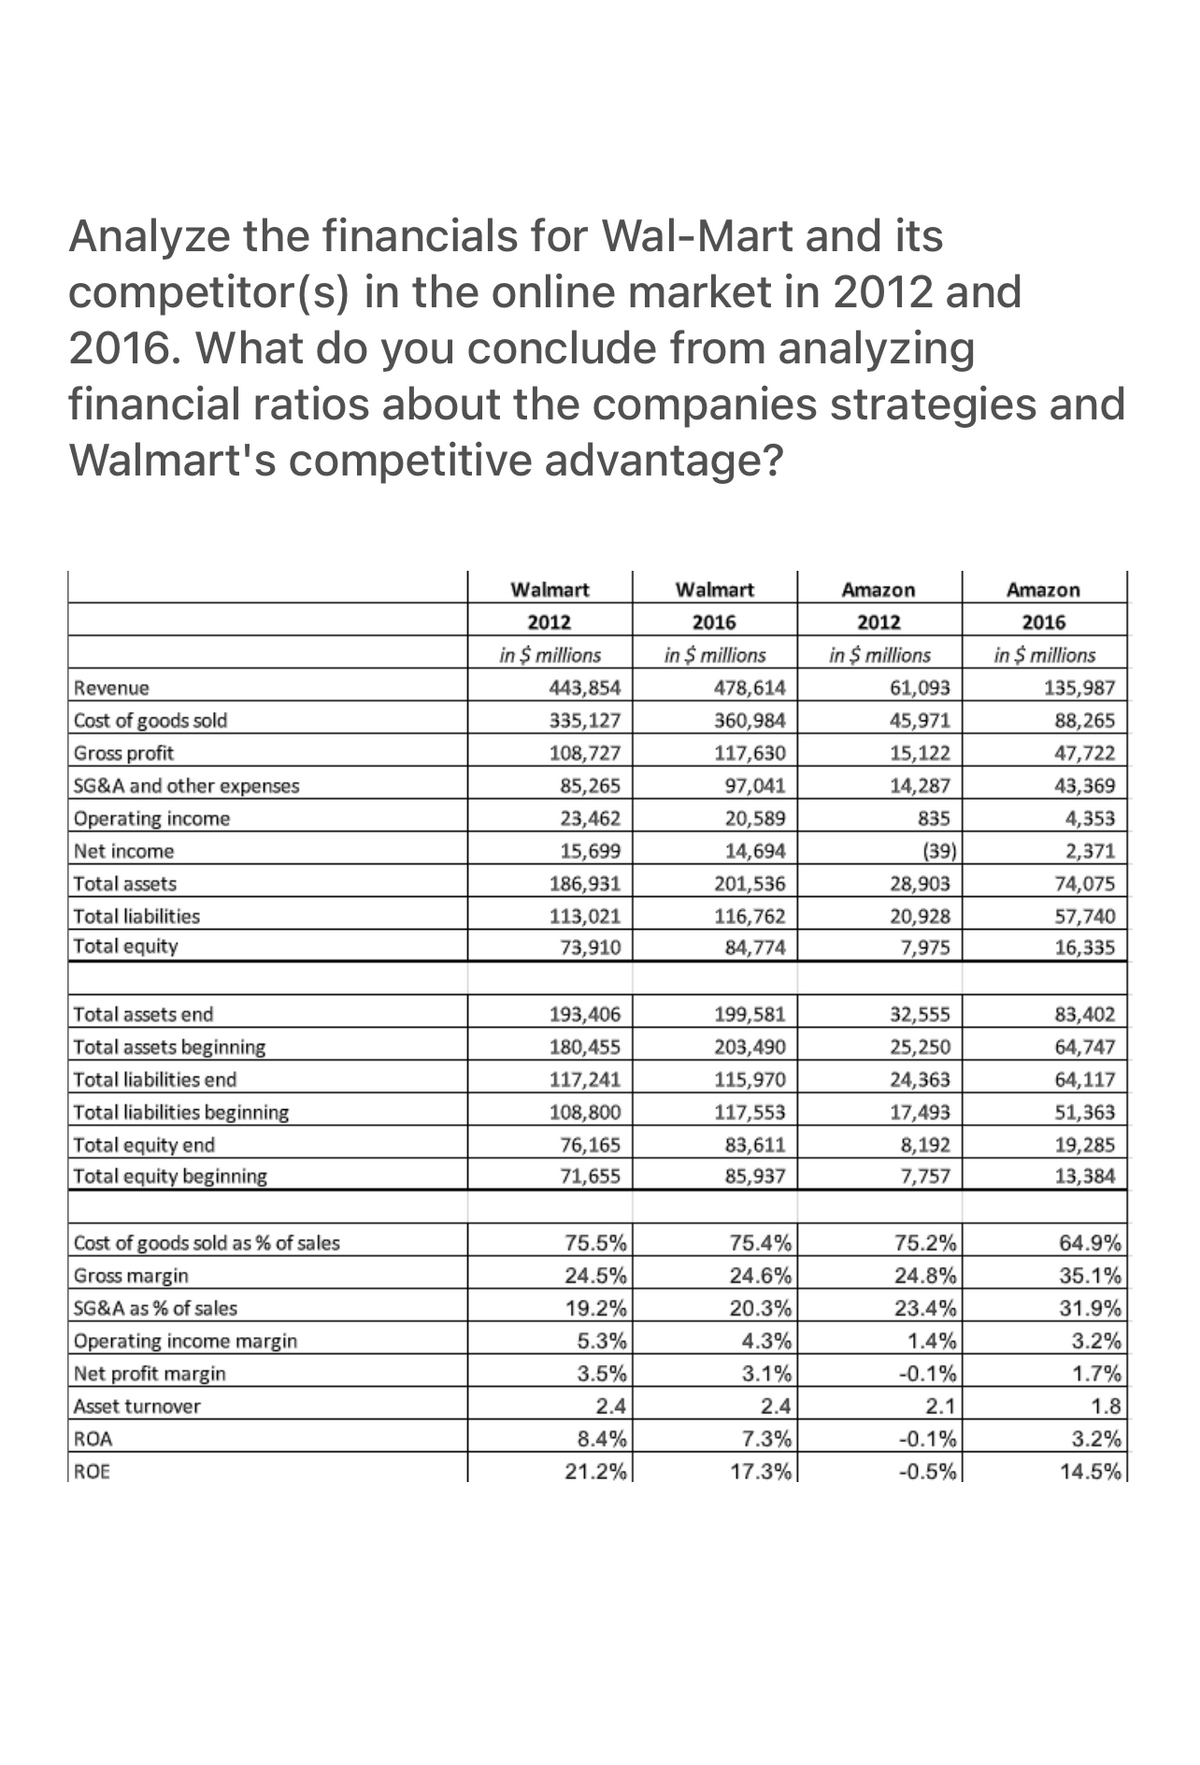
Transcribed Image Text:Analyze the financials for Wal-Mart and its
competitor(s) in the online market in 2012 and
2016. What do you conclude from analyzing
financial ratios about the companies strategies and
Walmart's competitive advantage?
Revenue
Cost of goods sold
Gross profit
SG&A and other expenses
Operating income
Net income
Total assets
Total liabilities
Total equity
Total assets end
Total assets beginning
Total liabilities end
Total liabilities beginning
Total equity end
Total equity beginning
Cost of goods sold as % of sales
Gross margin
SG&A as % of sales
Operating income margin
Net profit margin
Asset turnover
ROA
ROE
Walmart
2012
in $ millions
443,854
335,127
108,727
85,265
23,462
15,699
186,931
113,021
73,910
193,406
180,455
117,241
108,800
76,165
71,655
75.5%
24.5%
19.2%
5.3%
3.5%
2.4
8.4%
21.2%
Walmart
2016
in $ millions
478,614
360,984
117,630
97,041
20,589
14,694
201,536
116,762
84,774
199,581
203,490
115,970
117,553
83,611
85,937
75.4%
24.6%
20.3%
4.3%
3.1%
2.4
7.3%
17.3%
Amazon
2012
in $ millions
61,093
45,971
15,122
14,287
835
(39)
28,903
20,928
7,975
32,555
25,250
24,363
17,493
8,192
7,757
75.2%
24.8%
23.4%
1.4%
-0.1%
2.1
-0.1%
-0.5%
Amazon
2016
in $ millions
135,987
88,265
47,722
43,369
4,353
2,371
74,075
57,740
16,335
83,402
64,747
64,117
51,363
19,285
13,384
64.9%
35.1%
31.9%
3.2%
1.7%
1.8
3.2%
14.5%
Expert Solution
This question has been solved!
Explore an expertly crafted, step-by-step solution for a thorough understanding of key concepts.

Step by step
Solved in 2 steps

Knowledge Booster


Learn more about
Need a deep-dive on the concept behind this application? Look no further. Learn more about this topic, finance and related others by exploring similar questions and additional content below.Recommended textbooks for you

Managerial Accounting: The Cornerstone of Busines…
Accounting
ISBN:
9781337115773
Author:
Maryanne M. Mowen, Don R. Hansen, Dan L. Heitger
Publisher:
Cengage Learning

Survey of Accounting (Accounting I)
Accounting
ISBN:
9781305961883
Author:
Carl Warren
Publisher:
Cengage Learning
Managerial Accounting: The Cornerstone of Busines…
Accounting
ISBN:
9781337115773
Author:
Maryanne M. Mowen, Don R. Hansen, Dan L. Heitger
Publisher:
Cengage Learning
Survey of Accounting (Accounting I)
Accounting
ISBN:
9781305961883
Author:
Carl Warren
Publisher:
Cengage Learning

Cornerstones of Financial Accounting
Accounting
ISBN:
9781337690881
Author:
Jay Rich, Jeff Jones
Publisher:
Cengage Learning

Financial Accounting: The Impact on Decision Make…
Accounting
ISBN:
9781305654174
Author:
Gary A. Porter, Curtis L. Norton
Publisher:
Cengage Learning