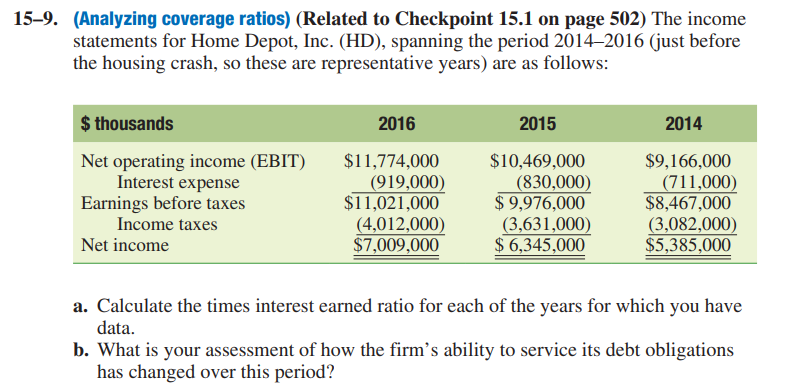
(Analyzing coverage ratios) (Related to Checkpoint 15.1 on page 502) The income statements for Home Depot, Inc. (HD), spanning the period 2014–2016 (just before the housing crash, so these are representative years) are as follows: $ thousands 2016 2015 2014 Net operating income (EBIT) Interest expense Earnings before taxes Income taxes $11,774,000 (919,000) $11,021,000 (4,012,000) $7,009,000 $10,469,000 (830,000) $ 9,976,000 (3,631,000) $ 6,345,000 $9,166,000 |(711,000) $8,467,000 (3,082,000) $5,385,000 Net income a. Calculate the times interest earned ratio for each of the years for which you have data. b. What is your assessment of how the firm's ability to service its debt obligations has changed over this period?
(Analyzing coverage ratios) (Related to Checkpoint 15.1 on page 502) The income statements for Home Depot, Inc. (HD), spanning the period 2014–2016 (just before the housing crash, so these are representative years) are as follows: $ thousands 2016 2015 2014 Net operating income (EBIT) Interest expense Earnings before taxes Income taxes $11,774,000 (919,000) $11,021,000 (4,012,000) $7,009,000 $10,469,000 (830,000) $ 9,976,000 (3,631,000) $ 6,345,000 $9,166,000 |(711,000) $8,467,000 (3,082,000) $5,385,000 Net income a. Calculate the times interest earned ratio for each of the years for which you have data. b. What is your assessment of how the firm's ability to service its debt obligations has changed over this period?

Financial Reporting, Financial Statement Analysis and Valuation
8th Edition
ISBN:9781285190907
Author:James M. Wahlen, Stephen P. Baginski, Mark Bradshaw
Publisher:James M. Wahlen, Stephen P. Baginski, Mark Bradshaw
Chapter4: Profitability Analysis
Section: Chapter Questions
Problem 23PC

Related questions
Question
Transcribed Image Text:15-9. (Analyzing coverage ratios) (Related to Checkpoint 15.1 on page 502) The income
statements for Home Depot, Inc. (HD), spanning the period 2014–2016 (just before
the housing crash, so these are representative years) are as follows:
$ thousands
2016
2015
2014
Net operating income (EBIT)
Interest expense
Earnings before taxes
Income taxes
$11,774,000
(919,000)
$11,021,000
(4,012,000)
$7,009,000
$10,469,000
(830,000)
$ 9,976,000
(3,631,000)
$ 6,345,000
$9,166,000
(711,000)
$8,467,000
(3,082,000)
$5,385,000
Net income
a. Calculate the times interest earned ratio for each of the years for which you have
data.
b. What is your assessment of how the firm's ability to service its debt obligations
has changed over this period?
Expert Solution
This question has been solved!
Explore an expertly crafted, step-by-step solution for a thorough understanding of key concepts.

This is a popular solution!

Trending now
This is a popular solution!

Step by step
Solved in 3 steps with 2 images

Recommended textbooks for you
Financial Reporting, Financial Statement Analysis…
Finance
ISBN:
9781285190907
Author:
James M. Wahlen, Stephen P. Baginski, Mark Bradshaw
Publisher:
Cengage Learning
Financial Reporting, Financial Statement Analysis…
Finance
ISBN:
9781285190907
Author:
James M. Wahlen, Stephen P. Baginski, Mark Bradshaw
Publisher:
Cengage Learning