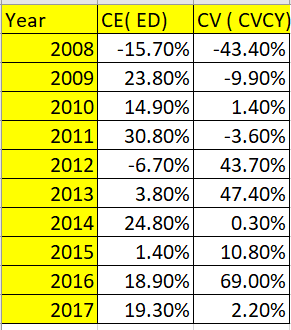
Please refer to your textbook, page 210 (NOTE: if you are using another textbook edition, data may appear on a later page, keep looking!) Specifically, you will be using the actual annual HPR data for Consolidated Edison (symbol: ED) and Central Valley Community Bancorp (symbol: CVCY). I.e., 2008-2017 HPR data for ED & CYCY. Answer only the following questions, do not look at any of the questions in the textbook. Using Excel spreadsheet: Determine the expected return (average) for both ED & CVCY. Determine the standard deviation of returns for both ED & CVCY. Determine the correlation coefficient between ED & CVCY. Suppose you want to construct a 2-asset portfolio using: 90% ED & 10% CVCY. Calculate this portfolio's expected return and standard deviation*. Any improvement of this


The Effect Of Prepaid Taxes On Assets And Liabilities
Many businesses estimate tax liability and make payments throughout the year (often quarterly). When a company overestimates its tax liability, this results in the business paying a prepaid tax. Prepaid taxes will be reversed within one year but can result in prepaid assets and liabilities.
Final Accounts
Financial accounting is one of the branches of accounting in which the transactions arising in the business over a particular period are recorded.
Ledger Posting
A ledger is an account that provides information on all the transactions that have taken place during a particular period. It is also known as General Ledger. For example, your bank account statement is a general ledger that gives information about the amount paid/debited or received/ credited from your bank account over some time.
Trial Balance and Final Accounts
In accounting we start with recording transaction with journal entries then we make separate ledger account for each type of transaction. It is very necessary to check and verify that the transaction transferred to ledgers from the journal are accurately recorded or not. Trial balance helps in this. Trial balance helps to check the accuracy of posting the ledger accounts. It helps the accountant to assist in preparing final accounts. It also helps the accountant to check whether all the debits and credits of items are recorded and posted accurately. Like in a balance sheet debit and credit side should be equal, similarly in trial balance debit balance and credit balance should tally.
Adjustment Entries
At the end of every accounting period Adjustment Entries are made in order to adjust the accounts precisely replicate the expenses and revenue of the current period. It is also known as end of period adjustment. It can also be referred as financial reporting that corrects the errors made previously in the accounting period. The basic characteristics of every adjustment entry is that it affects at least one real account and one nominal account.

"Hi, Thanks for the Question. Since you asked multiple sub parts questions, we will answer first three sub parts for you as per authoring guidelines. Kindly repost the other sub parts separately by specifying the sub parts you want us to answer. Thankyou."
In this case we are solving all sub parts of question-1

Trending now
This is a popular solution!

Step by step
Solved in 3 steps with 5 images


