and Kartaly are small countries that protect their economic growth from rapidly advancing globalization by limiting the import of televisions to illion. To this end, each country imposes a different type of trade barrier when the world price (Pw) is $3,000. In Aniva, the government decides pose a tariff of $2,000 per television; In Kartaly, the government implements a quota of 20 million televisions. me that Aniva and Kartaly have identical domestic demand (D₁) and supply (S) curves for televisions as shown on the following graph. Under conditions, the price of televisions is $5,000 per television in each country. PRICE (Dollars per television) 10000 9000-S:-100 8000-Y: 11000 7000 6000 5000 4000 3000 2000 1000 0 D D. S:-100 7:13:000 True (50,6000) 70, 600D) (60,5000) (40,5000 (20,3000) D 10 20 30 40 50 O False Slope:100 (60,7000) Y-1000 Country Aniva (tariff = $2,000) taly (quota 20 million televisions) (80,5000) (80,3000) 70 QUANTITY (Milions of televisions) ose that in both countries, demand for televisions rises from Du to D₁. 80 90 100 ming Aniva keeps the tariff at $2,000 per television, complete the first row of the following table by calculating each of the values given this ase in demand. Assuming Kartaly maintains a quota of 20 million televisions, complete the second row of the table by calculating each of the es given this increase in demand. Price Quantity Demanded at New Price (Dollars) (Millions of televisions) or False: The Increase in demand hurts domestic producers but helps domestic consumers in Kartaly. Imports (Millions of televisions)
and Kartaly are small countries that protect their economic growth from rapidly advancing globalization by limiting the import of televisions to illion. To this end, each country imposes a different type of trade barrier when the world price (Pw) is $3,000. In Aniva, the government decides pose a tariff of $2,000 per television; In Kartaly, the government implements a quota of 20 million televisions. me that Aniva and Kartaly have identical domestic demand (D₁) and supply (S) curves for televisions as shown on the following graph. Under conditions, the price of televisions is $5,000 per television in each country. PRICE (Dollars per television) 10000 9000-S:-100 8000-Y: 11000 7000 6000 5000 4000 3000 2000 1000 0 D D. S:-100 7:13:000 True (50,6000) 70, 600D) (60,5000) (40,5000 (20,3000) D 10 20 30 40 50 O False Slope:100 (60,7000) Y-1000 Country Aniva (tariff = $2,000) taly (quota 20 million televisions) (80,5000) (80,3000) 70 QUANTITY (Milions of televisions) ose that in both countries, demand for televisions rises from Du to D₁. 80 90 100 ming Aniva keeps the tariff at $2,000 per television, complete the first row of the following table by calculating each of the values given this ase in demand. Assuming Kartaly maintains a quota of 20 million televisions, complete the second row of the table by calculating each of the es given this increase in demand. Price Quantity Demanded at New Price (Dollars) (Millions of televisions) or False: The Increase in demand hurts domestic producers but helps domestic consumers in Kartaly. Imports (Millions of televisions)

Chapter21: International Trade And Finance
Section: Chapter Questions
Problem 10SQ

Related questions
Question
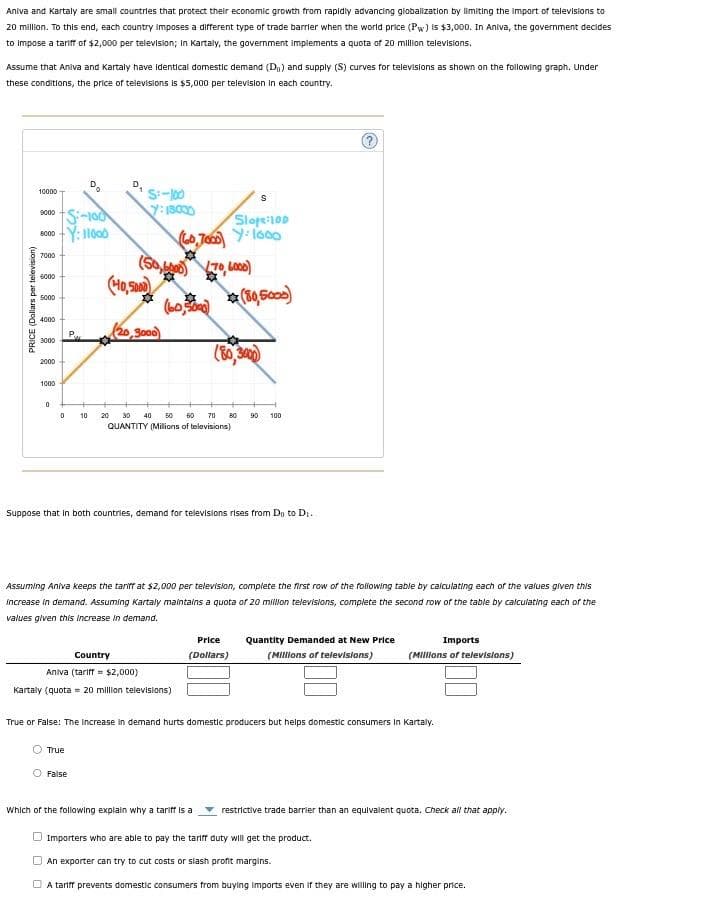
Transcribed Image Text:Aniva and kartaly are small countries that protect their economic growth from rapidly advancing globalization by limiting the import of televisions to
20 million. To this end, each country imposes a different type of trade barrier when the world price (Pw) is $3,000. In Aniva, the government decides
to impose a tariff of $2,000 per television; In Kartaly, the government implements a quota of 20 million televisions.
Assume that Aniva and Kartaly have identical domestic demand (D₁) and supply (S) curves for televisions as shown on the following graph. Under
these conditions, the price of televisions is $5,000 per television in each country.
PRICE (Dollars per television)
10000
9000
8000
7000
6000
5000
4000
3000
2000 +
1000
0
-S:-100
-Y: 11000
0
Do
P
D₁
True
S:-100
7:13.000
False
(40,5000)
(20,3000)
Slope:100
(60,7000 1600
☆
Country
Aniva (tariff = $2,000)
Kartaly (quota = 20 million televisions)
S
70,6000)
(60,5000) (80,5000)
Suppose that in both countries, demand for televisions rises from Do to D₁.
10 20 30 40 50 60 70 80 90 100
QUANTITY (Millions of televisions)
Assuming Aniva keeps the tariff at $2,000 per television, complete the first row of the following table by calculating each of the values given this
increase in demand. Assuming Kartaly maintains a quota of 20 million televisions, complete the second row of the table by calculating each of the
values given this increase in demand.
(80,3000)
Which of the following explain why a tariff is a
Price Quantity Demanded at New Price
(Dollars)
(Millions of televisions)
True or False: The increase in demand hurts domestic producers but helps domestic consumers in Kartaly.
Imports
(Millions of televisions)
restrictive trade barrier than an equivalent quota. Check all that apply.
Importers who are able to pay the tariff duty will get the product.
An exporter can try to cut costs or slash profit margins.
A tariff prevents domestic consumers from buying imports even if they are willing to pay a higher price.
Expert Solution
This question has been solved!
Explore an expertly crafted, step-by-step solution for a thorough understanding of key concepts.

This is a popular solution!

Trending now
This is a popular solution!

Step by step
Solved in 5 steps with 1 images

Knowledge Booster


Learn more about
Need a deep-dive on the concept behind this application? Look no further. Learn more about this topic, economics and related others by exploring similar questions and additional content below.Recommended textbooks for you


