Answer ALL Questions Time: 2 Hours Q3: Classify the following soil by using the Unified soil classification system. Give the group symbols and the group names. Table 1. Sample 1 Grain Size Aesults (ASTM D422). Table 2. Atterberg Limits Results (ASTM D4318). Sleve No. Dia. (mm) % Passing Sample LL PL % in 12.7 100 60 40 14 4.75 97 #10 2 94 #20 0.85 84 #40 0.425 57 #60 0.25 32 #140 0.106 15 #200 0.075
Answer ALL Questions Time: 2 Hours Q3: Classify the following soil by using the Unified soil classification system. Give the group symbols and the group names. Table 1. Sample 1 Grain Size Aesults (ASTM D422). Table 2. Atterberg Limits Results (ASTM D4318). Sleve No. Dia. (mm) % Passing Sample LL PL % in 12.7 100 60 40 14 4.75 97 #10 2 94 #20 0.85 84 #40 0.425 57 #60 0.25 32 #140 0.106 15 #200 0.075

Chapter2: Loads On Structures
Section: Chapter Questions
Problem 1P

Related questions

Question
Transcribed Image Text:Answer ALL Questions
Time: 2 Hours
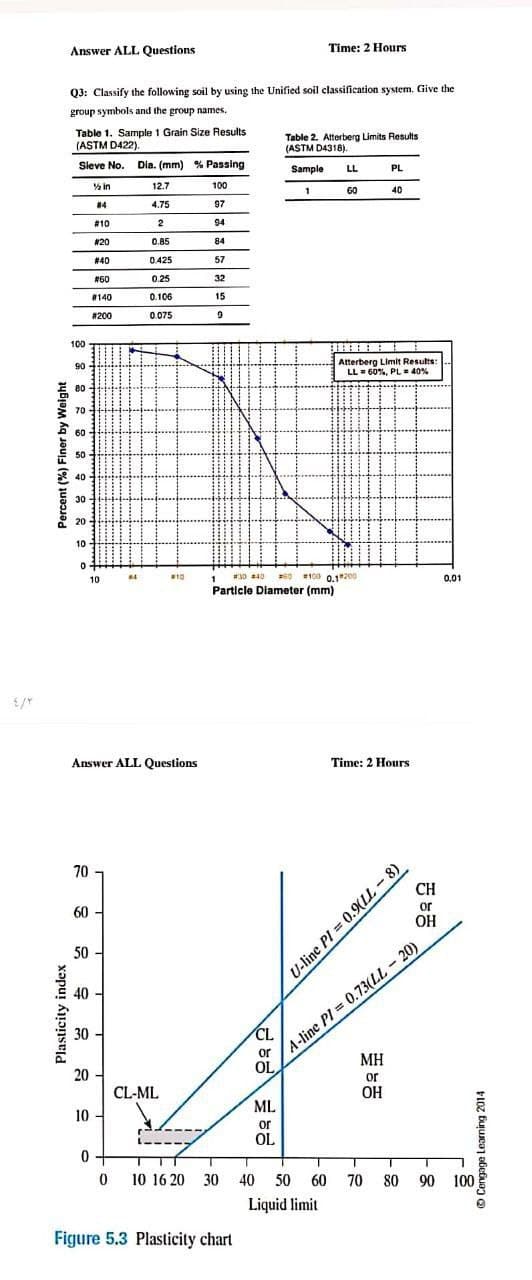
Q3: Classify the following soil by using the Unified soil classification system. Give the
group symbols and the group names.
Table 1. Sample 1 Grain Size Results
(ASTM D422).
Table 2. Atterberg Limits Results
(ASTM D4318).
Sleve No. Dia. (mm) % Passing
Sample
PL
LL
% in
12.7
100
G0
40
14
4.75
97
#10
2
94
#20
0.85
84
# 40
0.425
57
#60
0.25
32
140
0.106
15
#200
0.075
100
90
Atterberg Limit Results:
LL = 60%, PL = 40%
E 80
* 70-
60 -
50
40
30-
a 20
10
1 30 a40
100 0.1200
10
80
0.01
Particle Diameter (mm)
Answer ALL Questions
Time: 2 Hours
70
CH
or
OH
60
A-line PI = 0.73(LL - 20)
Or
50
40
30
CL
MH
OL
20
or
CL-ML
OH
ML
10 -
or
OL
10 16 20 30
40 50
60 70 80
90 100
Liquid limit
Figure 5.3 Plasticity chart
Percent (%) Finer by Weight
Plasticity index
U-line PI = 0.(LL - 8)
O Cengage Learning 2014
Expert Solution
This question has been solved!
Explore an expertly crafted, step-by-step solution for a thorough understanding of key concepts.

Step by step
Solved in 2 steps

Knowledge Booster


Learn more about
Need a deep-dive on the concept behind this application? Look no further. Learn more about this topic, civil-engineering and related others by exploring similar questions and additional content below.Recommended textbooks for you

Structural Analysis (10th Edition)
Civil Engineering
ISBN:
9780134610672
Author:
Russell C. Hibbeler
Publisher:
PEARSON

Principles of Foundation Engineering (MindTap Cou…
Civil Engineering
ISBN:
9781337705028
Author:
Braja M. Das, Nagaratnam Sivakugan
Publisher:
Cengage Learning
Structural Analysis (10th Edition)
Civil Engineering
ISBN:
9780134610672
Author:
Russell C. Hibbeler
Publisher:
PEARSON
Principles of Foundation Engineering (MindTap Cou…
Civil Engineering
ISBN:
9781337705028
Author:
Braja M. Das, Nagaratnam Sivakugan
Publisher:
Cengage Learning

Fundamentals of Structural Analysis
Civil Engineering
ISBN:
9780073398006
Author:
Kenneth M. Leet Emeritus, Chia-Ming Uang, Joel Lanning
Publisher:
McGraw-Hill Education


Traffic and Highway Engineering
Civil Engineering
ISBN:
9781305156241
Author:
Garber, Nicholas J.
Publisher:
Cengage Learning