answer for letter d and e

Glencoe Algebra 1, Student Edition, 9780079039897, 0079039898, 2018
18th Edition
ISBN:9780079039897
Author:Carter
Publisher:Carter
Chapter4: Equations Of Linear Functions
Section: Chapter Questions
Problem 8SGR

Related questions
Question
answer for letter d and e
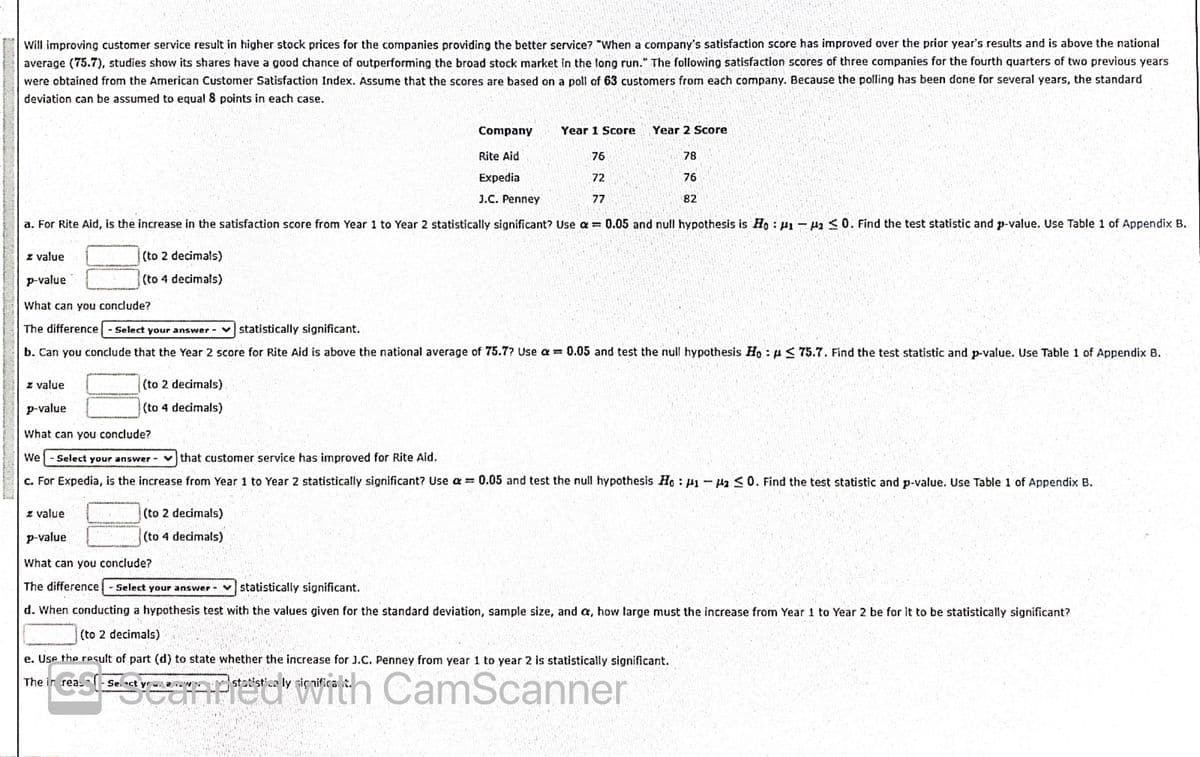
Transcribed Image Text:Will improving customer service result in higher stock prices for the companies providing the better service? "When a company's satisfaction score has improved over the prior year's results and is above the national
average (75.7), studies show its shares have a good chance of outperforming the broad stock market in the long run." The following satisfaction scores of three companies for the fourth quarters of two previous years
were obtained from the American Customer Satisfaction Index. Assume that the scores are based on a poll of 63 customers from each company. Because the polling has been done for several years, the standard
deviation can be assumed to equal 8 points in each case.
ETT
Company
Year 1 Score
Year 2 Score
Rite Aid
76
78
Expedia
72
76
J.C. Penney
77
82
a. For Rite Aid, is the increase in the satisfaction score from Year 1 to Year 2 statistically significant? Use a 0.05 and null hypothesis is Ho : H1-H2 <0. Find the test statistic and p-value. Use Table 1 of Appendix B.
z value
(to 2 decimals)
p-value
(to 4 decimals)
What can you conclude?
The difference - Select your answer vstatistically significant.
b. Can you conclude that the Year 2 score for Rite Aid is above the national average of 75.7? Use a = 0.05 and test the null hypothesis Ho : p< 75.7. Find the test statistic and p-value. Use Table 1 of Appendix B.
z value
(to 2 decimals)
p-value
(to 4 decimals)
What can you conclude?
We
Select your answer - vthat customer service has improved for Rite Aid.
c. For Expedia, is the increase from Year 1 to Year 2 statistically significant? Use a = 0.05 and test the null hypothesis Ho H1- Ha S0. Find the test statistic and p-value. Use Table 1 of Appendix B.
z value
(to 2 decimals)
p-value
(to 4 decimals)
What can you conclude?
The difference
Select your answer - vstatistically significant.
d. When conducting a hypothesis test with the values given for the standard deviation, sample size, and a, how large must the increase from Year 1 to Year 2 be for it to be statistically significant?
(to 2 decimals)
e. Use the result of part (d) to state whether the increase for J.C. Penney from year 1 to year 2 is statistically significant.
a Pret vith
CamScanner
The in reas
ct yr .W.
stotist ca ly sic nifica
Expert Solution
This question has been solved!
Explore an expertly crafted, step-by-step solution for a thorough understanding of key concepts.

Step by step
Solved in 3 steps with 2 images

Recommended textbooks for you
Glencoe Algebra 1, Student Edition, 9780079039897…
Algebra
ISBN:
9780079039897
Author:
Carter
Publisher:
McGraw Hill
Glencoe Algebra 1, Student Edition, 9780079039897…
Algebra
ISBN:
9780079039897
Author:
Carter
Publisher:
McGraw Hill