Answer only 6-9

Algebra & Trigonometry with Analytic Geometry
13th Edition
ISBN:9781133382119
Author:Swokowski
Publisher:Swokowski
Chapter7: Analytic Trigonometry
Section7.6: The Inverse Trigonometric Functions
Problem 94E

Related questions

Question
Answer only 6-9, please
![In R [datarium package], the marketing dataset contains the impact of the
amount of money spent on three advertising medias (youtube, facebook and
newspaper) on sales. We want to build a model for estimating sales (y) based on the
advertising budget invested in youtube (x1), facebook (x2) and newspaper (x3). Use
the output provided to answer the questions below. After some trial and eror, the
following model was fit:
> model - Im(sales - youtube + facebook + newspaper, data - narketing)
> surmary(nodel)
Call:
Im(formula - sales - youtube + facebook + newspaper, data - morketing)
Residuals:
Min
10 Median
30
Max
-18.5932 -1.8690
0.2982 1.4272
3.3951
Coefficients:
Estimate Std. Error t value Pr(>Itl)
9.422 <2e-16 ***
<2e-16 ***
<2e-16 ***
0.86
(Intercept) 3.526667
8.045765
8.374290
agnanok
-0.001037
0.001395 32.809
facebook
0.188530
8.008611 21.893
newspaper
0.005871 -8.177
Signif. codes: 0 **** 0.001 ** 8.01 * 0.05 '.' 0.1 '1
Residual standord error: 2.023 on 196 degrees of freedon
Multiple R-squared: 0.8972,
F-statistic: 570.3 on 3 and 196 DF, p-value: < 2.Ze-16
Adjusted R-squared: 0.8956
1. (pis) Write down the multiple linear regression model from the
regression analysis result.
2. pic s) This model is able to explain_
observed variability in
relationship with the other variables.
3. (5 poiuts) Interpret the slope coefficient of facebook in context.
4. (5 poiuts) Interpret the intercept coefficient in context.
5. (S poinis) Comment on the overall significance of the model, at a 0.05 significant
% of the
using its linear
level
6. (10 points) Design and conduct a hypothesis test to check if the variable
newspaper in the context is significant, at a 0.05 significant level. (State your](/v2/_next/image?url=https%3A%2F%2Fcontent.bartleby.com%2Fqna-images%2Fquestion%2F3bfd194c-b3f7-49d1-9e18-7869d9042f91%2F72fbcb5a-236b-47d6-91d7-a1233121f771%2F6t43r5r_processed.jpeg&w=3840&q=75)
Transcribed Image Text:In R [datarium package], the marketing dataset contains the impact of the
amount of money spent on three advertising medias (youtube, facebook and
newspaper) on sales. We want to build a model for estimating sales (y) based on the
advertising budget invested in youtube (x1), facebook (x2) and newspaper (x3). Use
the output provided to answer the questions below. After some trial and eror, the
following model was fit:
> model - Im(sales - youtube + facebook + newspaper, data - narketing)
> surmary(nodel)
Call:
Im(formula - sales - youtube + facebook + newspaper, data - morketing)
Residuals:
Min
10 Median
30
Max
-18.5932 -1.8690
0.2982 1.4272
3.3951
Coefficients:
Estimate Std. Error t value Pr(>Itl)
9.422 <2e-16 ***
<2e-16 ***
<2e-16 ***
0.86
(Intercept) 3.526667
8.045765
8.374290
agnanok
-0.001037
0.001395 32.809
facebook
0.188530
8.008611 21.893
newspaper
0.005871 -8.177
Signif. codes: 0 **** 0.001 ** 8.01 * 0.05 '.' 0.1 '1
Residual standord error: 2.023 on 196 degrees of freedon
Multiple R-squared: 0.8972,
F-statistic: 570.3 on 3 and 196 DF, p-value: < 2.Ze-16
Adjusted R-squared: 0.8956
1. (pis) Write down the multiple linear regression model from the
regression analysis result.
2. pic s) This model is able to explain_
observed variability in
relationship with the other variables.
3. (5 poiuts) Interpret the slope coefficient of facebook in context.
4. (5 poiuts) Interpret the intercept coefficient in context.
5. (S poinis) Comment on the overall significance of the model, at a 0.05 significant
% of the
using its linear
level
6. (10 points) Design and conduct a hypothesis test to check if the variable
newspaper in the context is significant, at a 0.05 significant level. (State your
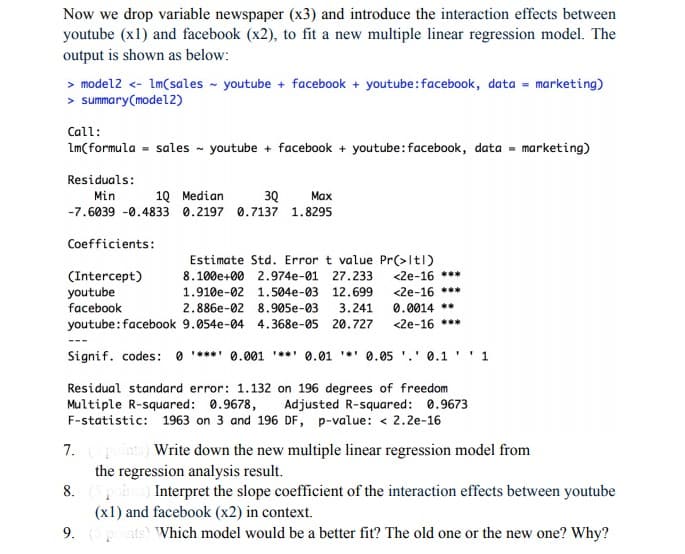
Transcribed Image Text:Now we drop variable newspaper (x3) and introduce the interaction effects between
youtube (x1) and facebook (x2), to fit a new multiple linear regression model. The
output is shown as below:
> model2 <- Im(sales - youtube + facebook + youtube:facebook, data = marketing)
> summary(model2)
Call:
Lm(formula = sales - youtube + facebook + youtube:facebook, data = marketing)
Residuals:
Min
10 Median
30
Маx
-7.6039 -0.4833 0.2197 0.7137 1.8295
Coefficients:
Estimate Std. Error t value Pr(>Itl)
<2e-16 ***
(Intercept)
youtube
facebook
8.100e+00 2.974e-01
27.233
<2e-16 ***
0.0014 **
<2e-16 ***
1.910e-02 1.504e-03 12.699
2.886e-02 8.905e-03
3.241
youtube:facebook 9.054e-04 4.368e-05 20.727
Signif. codes: 0 ***** 0.001 *** 0.01 *' 0.05 '.' 0.1 '' 1
Residual standard error: 1.132 on 196 degrees of freedom
Multiple R-squared: 0.9678,
F-statistic: 1963 on 3 and 196 DF, p-value: < 2.2e-16
Adjusted R-squared: 0.9673
7.
the regression analysis result.
Write down the new multiple linear regression model from
8.
Interpret the slope coefficient of the interaction effects between youtube
(x1) and facebook (x2) in context.
9. ts Which model would be a better fit? The old one or the new one? Why?
Expert Solution
This question has been solved!
Explore an expertly crafted, step-by-step solution for a thorough understanding of key concepts.

This is a popular solution!

Trending now
This is a popular solution!

Step by step
Solved in 2 steps

Knowledge Booster


Learn more about
Need a deep-dive on the concept behind this application? Look no further. Learn more about this topic, statistics and related others by exploring similar questions and additional content below.Recommended textbooks for you
Algebra & Trigonometry with Analytic Geometry
Algebra
ISBN:
9781133382119
Author:
Swokowski
Publisher:
Cengage

Algebra for College Students
Algebra
ISBN:
9781285195780
Author:
Jerome E. Kaufmann, Karen L. Schwitters
Publisher:
Cengage Learning

Functions and Change: A Modeling Approach to Coll…
Algebra
ISBN:
9781337111348
Author:
Bruce Crauder, Benny Evans, Alan Noell
Publisher:
Cengage Learning
Algebra & Trigonometry with Analytic Geometry
Algebra
ISBN:
9781133382119
Author:
Swokowski
Publisher:
Cengage
Algebra for College Students
Algebra
ISBN:
9781285195780
Author:
Jerome E. Kaufmann, Karen L. Schwitters
Publisher:
Cengage Learning
Functions and Change: A Modeling Approach to Coll…
Algebra
ISBN:
9781337111348
Author:
Bruce Crauder, Benny Evans, Alan Noell
Publisher:
Cengage Learning

Algebra and Trigonometry (MindTap Course List)
Algebra
ISBN:
9781305071742
Author:
James Stewart, Lothar Redlin, Saleem Watson
Publisher:
Cengage Learning