Answer the following questions concerning the data below and then graph it: Blood Glucose Patient A Blood Glucose Patient B (mM of glucose/ Liter of Blood) Time After (mM of glucose/ Liter of Blood) Eating (hours) 0.5 170 180 1 155 195 1.5 140 230 2 135 245 2.5 140 235 135 225 4 130 200 1. What is the dependent variable and why? 2. What is the independent variable and why? 3. What title would you give the graph? 4. What type of graph will you make? 5. Now make your graph that includes: title, plotted data points, and labeled x- and y-axes.
Answer the following questions concerning the data below and then graph it: Blood Glucose Patient A Blood Glucose Patient B (mM of glucose/ Liter of Blood) Time After (mM of glucose/ Liter of Blood) Eating (hours) 0.5 170 180 1 155 195 1.5 140 230 2 135 245 2.5 140 235 135 225 4 130 200 1. What is the dependent variable and why? 2. What is the independent variable and why? 3. What title would you give the graph? 4. What type of graph will you make? 5. Now make your graph that includes: title, plotted data points, and labeled x- and y-axes.

Chapter26: Medications Used In Treatment Of Endocrine Disorders
Section: Chapter Questions
Problem 5RQ

Related questions
Question
100%
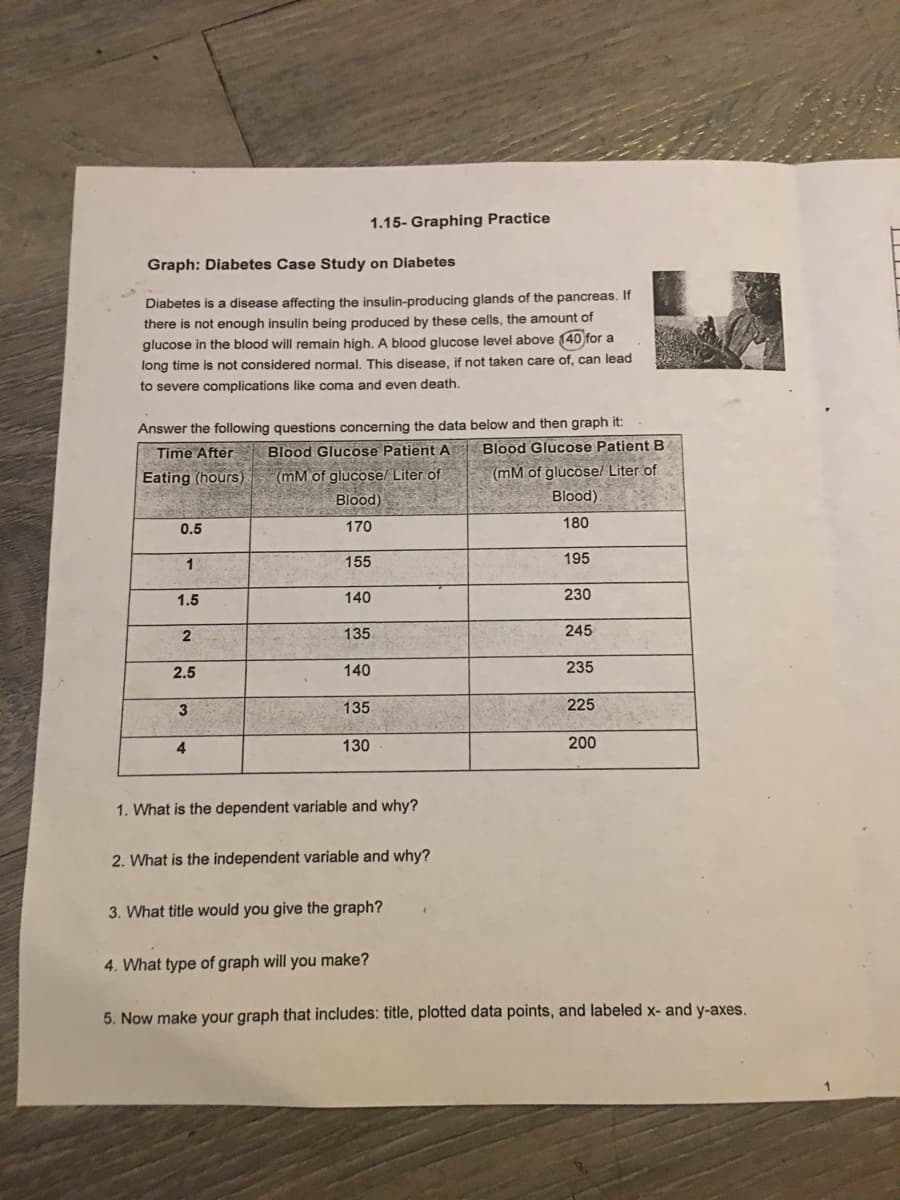
Transcribed Image Text:1.15- Graphing Practice
Graph: Diabetes Case Study on Diabetes
Diabetes is a disease affecting the insulin-producing glands of the pancreas. If
there is not enough insulin being produced by these cells, the amount of
glucose in the blood will remain high. A blood glucose level above (40 for a
long time is not considered normal. This disease, if not taken care of, can lead
to severe complications like coma and even death.
Answer the following questions concerning the data below and then graph it:
Blood Glucose Patient B
(mM of glucose/ Liter of
Time After Blood Glucose Patient A
(mM of glucose/ Liter of
Blood)
Eating (hours)
Blood)
0.5
170
180
1
155
195
1.5
140
230
2.
135
245
2.5
140
235
135
225
4
130
200
1. What is the dependent variable and why?
2. What is the independent variable and why?
3. What title would you give the graph?
4. What type of graph will you make?
5. Now make your graph that includes: title, plotted data points, and labeled x- and y-axes.
Expert Solution
This question has been solved!
Explore an expertly crafted, step-by-step solution for a thorough understanding of key concepts.

This is a popular solution!

Trending now
This is a popular solution!

Step by step
Solved in 5 steps with 1 images

Recommended textbooks for you
Essentials of Pharmacology for Health Professions
Nursing
ISBN:
9781305441620
Author:
WOODROW
Publisher:
Cengage
Essentials of Pharmacology for Health Professions
Nursing
ISBN:
9781305441620
Author:
WOODROW
Publisher:
Cengage