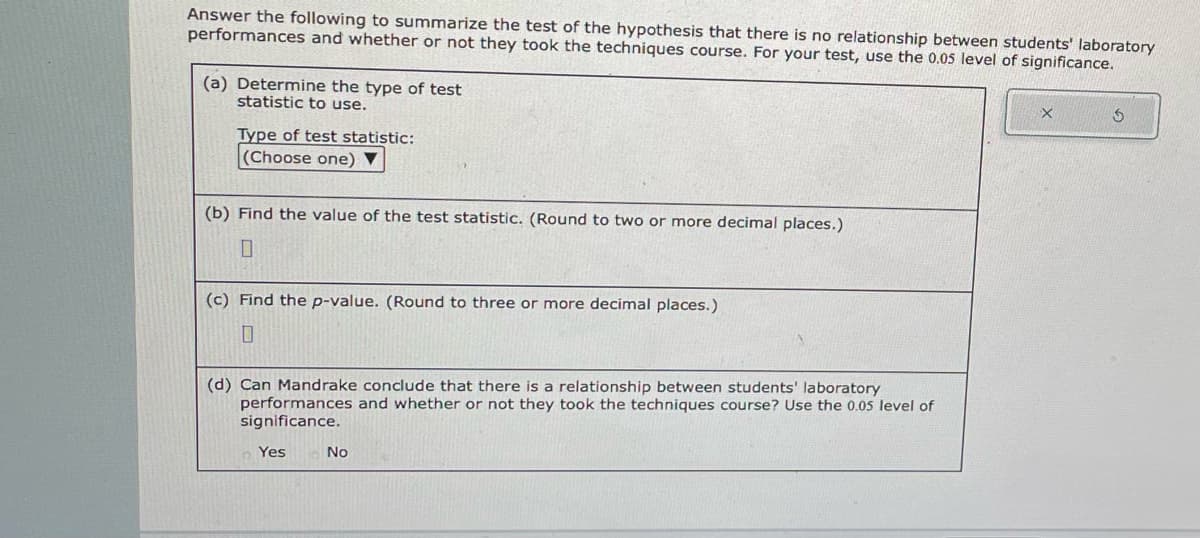
Answer the following to summarize the test of the hypothesis that there is no relationship between students' laboratory performances and whether or not they took the techniques course. For your test, use the 0.05 level of significance. (a) Determine the type of test statistic to use. Type of test statistic: (Choose one) ▼ (b) Find the value of the test statistic. (Round to two or more decimal places.) 0 (c) Find the p-value. (Round to three or more decimal places.) 10 (d) Can Mandrake conclude that there is a relationship between students' laboratory performances and whether or not they took the techniques course? Use the 0.05 level of significance. Yes No X $
Answer the following to summarize the test of the hypothesis that there is no relationship between students' laboratory performances and whether or not they took the techniques course. For your test, use the 0.05 level of significance. (a) Determine the type of test statistic to use. Type of test statistic: (Choose one) ▼ (b) Find the value of the test statistic. (Round to two or more decimal places.) 0 (c) Find the p-value. (Round to three or more decimal places.) 10 (d) Can Mandrake conclude that there is a relationship between students' laboratory performances and whether or not they took the techniques course? Use the 0.05 level of significance. Yes No X $

Functions and Change: A Modeling Approach to College Algebra (MindTap Course List)
6th Edition
ISBN:9781337111348
Author:Bruce Crauder, Benny Evans, Alan Noell
Publisher:Bruce Crauder, Benny Evans, Alan Noell
Chapter5: A Survey Of Other Common Functions
Section5.3: Modeling Data With Power Functions
Problem 6E: Urban Travel Times Population of cities and driving times are related, as shown in the accompanying...

Related questions
Question
Transcribed Image Text:Answer the following to summarize the test of the hypothesis that there is no relationship between students' laboratory
performances and whether or not they took the techniques course. For your test, use the 0.05 level of significance.
(a) Determine the type of test
statistic to use.
Type of test statistic:
(Choose one) ▼
(b) Find the value of the test statistic. (Round to two or more decimal places.)
0
(c) Find the p-value. (Round to three or more decimal places.)
0
(d) Can Mandrake conclude that there is a relationship between students' laboratory
performances and whether or not they took the techniques course? Use the 0.05 level of
significance.
Yes
No
X
S
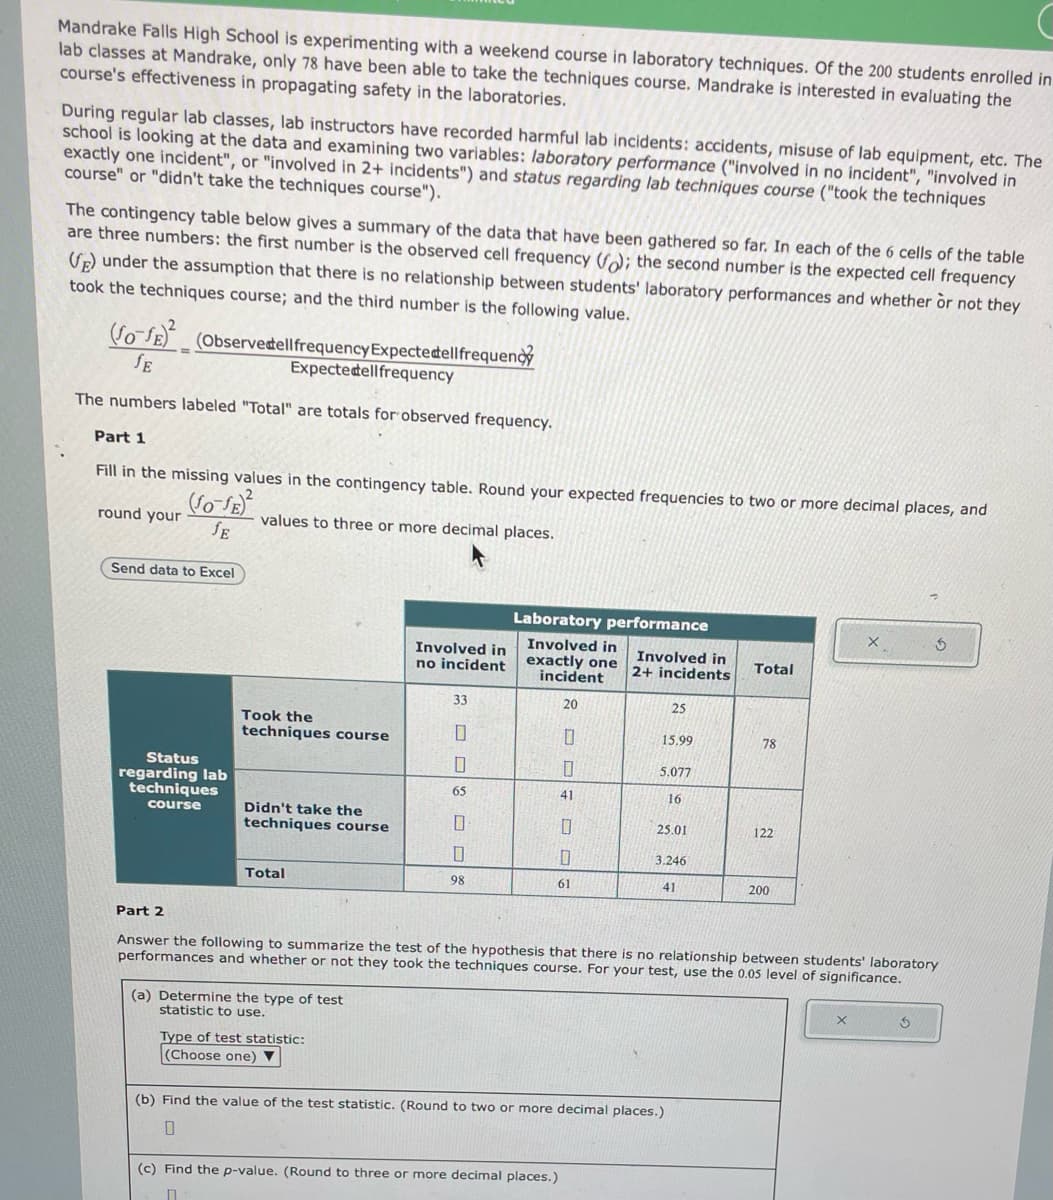
Transcribed Image Text:Mandrake Falls High School is experimenting with a weekend course in laboratory techniques. Of the 200 students enrolled in
lab classes at Mandrake, only 78 have been able to take the techniques course. Mandrake is interested in evaluating the
course's effectiveness in propagating safety in the laboratories.
During regular lab classes, lab instructors have recorded harmful lab incidents: accidents, misuse of lab equipment, etc. The
school is looking at the data and examining two variables: laboratory performance ("involved in no incident", "involved in
exactly one incident", or "involved in 2+ incidents") and status regarding lab techniques course ("took the techniques
course" or "didn't take the techniques course").
The contingency table below gives a summary of the data that have been gathered so far. In each of the 6 cells of the table
are three numbers: the first number is the observed cell frequency (f); the second number is the expected cell frequency
(E) under the assumption that there is no relationship between students' laboratory performances and whether or not they
took the techniques course; and the third number is the following value.
(fo-fE) (Observedell frequency Expecte dellfrequenc
SE
Expectedellfrequency
The numbers labeled "Total" are totals for observed frequency.
Part 1
Fill in the missing values in the contingency table. Round your expected frequencies to two or more decimal places, and
round your
(SO-SE)²
JE
values to three or more decimal places.
Send data to Excel
Status
regarding lab
techniques
course
Took the
techniques course
Didn't take the
techniques course
Total
(a) Determine the type of test
statistic to use.
Involved in
no incident
Type of test statistic:
(Choose one) ▼
33
0
SE
65
10
0
98
Laboratory performance
Involved in
exactly one
incident
20
0
0
41
0
0
61
(c) Find the p-value. (Round to three or more decimal places.)
□
Involved in
2+ incidents
25
15.99
5.077
16
25.01
3.246
41
(b) Find the value of the test statistic. (Round to two or more decimal places.)
0
Total
Part 2
Answer the following to summarize the test of the hypothesis that there is no relationship between students' laboratory
performances and whether or not they took the techniques course. For your test, use the 0.05 level of significance.
78
122
200
X
3
Expert Solution
This question has been solved!
Explore an expertly crafted, step-by-step solution for a thorough understanding of key concepts.

Step by step
Solved in 3 steps

Recommended textbooks for you
Functions and Change: A Modeling Approach to Coll…
Algebra
ISBN:
9781337111348
Author:
Bruce Crauder, Benny Evans, Alan Noell
Publisher:
Cengage Learning

Glencoe Algebra 1, Student Edition, 9780079039897…
Algebra
ISBN:
9780079039897
Author:
Carter
Publisher:
McGraw Hill

Big Ideas Math A Bridge To Success Algebra 1: Stu…
Algebra
ISBN:
9781680331141
Author:
HOUGHTON MIFFLIN HARCOURT
Publisher:
Houghton Mifflin Harcourt
Functions and Change: A Modeling Approach to Coll…
Algebra
ISBN:
9781337111348
Author:
Bruce Crauder, Benny Evans, Alan Noell
Publisher:
Cengage Learning
Glencoe Algebra 1, Student Edition, 9780079039897…
Algebra
ISBN:
9780079039897
Author:
Carter
Publisher:
McGraw Hill
Big Ideas Math A Bridge To Success Algebra 1: Stu…
Algebra
ISBN:
9781680331141
Author:
HOUGHTON MIFFLIN HARCOURT
Publisher:
Houghton Mifflin Harcourt