Answer the following. (a) The variation in the sample y-values that is not explained by the estimated linear relationship between x and y is given by the (Choose one) which for these data is (Choose one) (b) The value ² is the proportion of the total variation in the sample y-values that is explained by the estimated linear relationship between x and y. For these data, the value of ² is. (Round your answer to at least 2 decimal places.) data. The term "best
Answer the following. (a) The variation in the sample y-values that is not explained by the estimated linear relationship between x and y is given by the (Choose one) which for these data is (Choose one) (b) The value ² is the proportion of the total variation in the sample y-values that is explained by the estimated linear relationship between x and y. For these data, the value of ² is. (Round your answer to at least 2 decimal places.) data. The term "best

Glencoe Algebra 1, Student Edition, 9780079039897, 0079039898, 2018
18th Edition
ISBN:9780079039897
Author:Carter
Publisher:Carter
Chapter4: Equations Of Linear Functions
Section4.5: Correlation And Causation
Problem 24PFA

Related questions
Question
100%
answer options in order of sentence:
a) given by the…error sum of squares, regression sum of squares, or total sum of squares
which for these data is…2.3511, 14.0520, or 11.6983
c) that minimizes the…error sum of squares, regression sum of squares, or total sum of squares
which for these data is 2.3511, 14.0520, or 11.6983
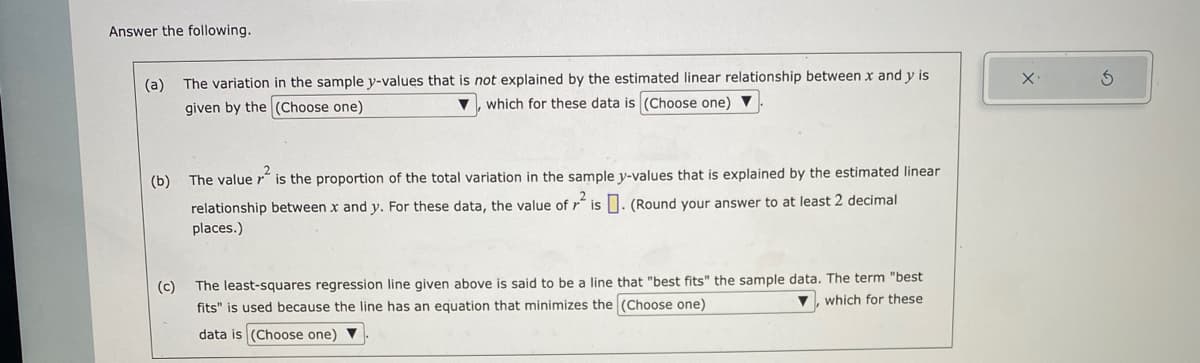
Transcribed Image Text:Answer the following.
(a) The variation in the sample y-values that is not explained by the estimated linear relationship between x and y is
given by the (Choose one)
which for these data is (Choose one)
(b)
(c)
The value ²
is the proportion of the total variation in the sample y-values that is explained by the estimated linear
relationship between x and y. For these data, the value of ² is. (Round your answer to at least 2 decimal
places.)
The least-squares regression line given above is said to be a line that "best fits" the sample data. The term "best
▼, which for these
fits" is used because the line has an equation that minimizes the (Choose one)
data is (Choose one) ▼
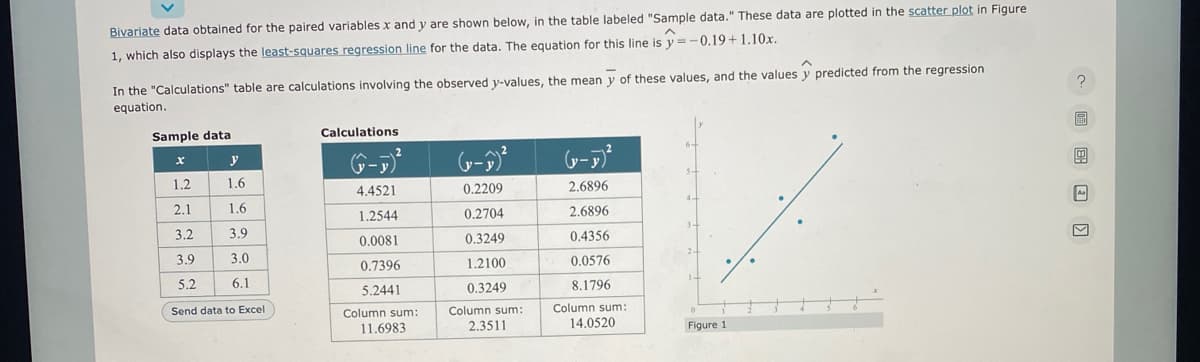
Transcribed Image Text:Bivariate data obtained for the paired variables x and y are shown below, in the table labeled "Sample data." These data are plotted in the scatter plot in Figure
1, which also displays the least-squares regression line for the data. The equation for this line is y=-0.19 +1.10x.
In the "Calculations" table are calculations involving the observed y-values, the mean y of these values, and the values y predicted from the regression
equation.
Sample data
x
y
1.6
1.6
3.9
3.0
6.1
1.2
2.1
3.2
3.9
5.2
Send data to Excel
Calculations
(1-5) ²
4.4521
1.2544
0.0081
0.7396
5.2441
Column sum:
11.6983
(-)2
0.2209
0.2704
0.3249
1.2100
0.3249
Column sum:
2.3511
(x-1)²
2.6896
2.6896
0.4356
0.0576
8.1796
Column sum:
14.0520
4+
0
Figure 1
?
G
4
Expert Solution
This question has been solved!
Explore an expertly crafted, step-by-step solution for a thorough understanding of key concepts.

This is a popular solution!

Trending now
This is a popular solution!

Step by step
Solved in 2 steps

Recommended textbooks for you
Glencoe Algebra 1, Student Edition, 9780079039897…
Algebra
ISBN:
9780079039897
Author:
Carter
Publisher:
McGraw Hill

Functions and Change: A Modeling Approach to Coll…
Algebra
ISBN:
9781337111348
Author:
Bruce Crauder, Benny Evans, Alan Noell
Publisher:
Cengage Learning
Glencoe Algebra 1, Student Edition, 9780079039897…
Algebra
ISBN:
9780079039897
Author:
Carter
Publisher:
McGraw Hill
Functions and Change: A Modeling Approach to Coll…
Algebra
ISBN:
9781337111348
Author:
Bruce Crauder, Benny Evans, Alan Noell
Publisher:
Cengage Learning