APPENDIX A Tables TABLE A-1 Binomial Probabilities .01 .05 .10 .20 .980 .30 .40 .50 .903 .810 .60 .70 .80 .640 .490 .90 .95 .99 .020 .095 .360 .250 .160 .180 .320 .090 .040 .010 .003 .420 .480 .500 .003 .010 .480 .420 .320 .040 .090 .180 .095 .020 .970 .857 .160 .250 .360 .490 .729 .512 .640 .810 .903 .029 .343 .216 .125 980 2 .135 .243 .064 .027 .008 .001 .384 .441 0+ 0+ .007 .432 .375 .288 .189 .027 .096 .096 .027 .007 3 0+ .189 .288 .375 .432 1 0+ .001 .441 .384 .243 .135 4 .008 .027 .064 .029 .961 .815 .125 .216 .343 .512 .656 .410 .729 .857 .970 3 .240 .130 .063 .026 .039 .171 .008 .002 0+ .292 .410 412 0+ .001 .346 .250 .154 .076 .026 .014 .049 .004 .154 .265 .346 .375 1 3 0+ 0+ .346 .265 .154 .049 .014 .004 .026 .076 .001 0+ .154 .250 .346 .412 .410 0+ .002 .292 .171 .039 3 .008 .026 .063 .130 .951 .774 .590 .240 .410 .656 .815 .961 .328 .168 .078 4 1 .031 .010 .002 0+ .048 .204 .328 0+ 0+ .410 .360 .259 .156 .001 .077 .028 .006 0+ 0+ .021 .073 .205 0+ 1 .309 .346 .313 .230 3 0+ .132 .051 .008 .001 .001 .008 .051 .132 .230 .313 .346 4 0+ .309 .205 .073 .021 .001 0+ .006 .028 3 .077 .156 .259 .360 5 0+ 0+ .410 .328 .204 .048 4 0+ 0+ .002 .010 .031 .078 .168 .328 .590 .774 .941 .735 .531 .262 .118 .951 5 .047 .016 .004 .001 .057 .232 .354 .393 0+ .303 .187 .094 .037 .010 .002 0+ .001 .031 .098 .246 .324 .311 .234 .138 .060 .015 .001 +0 3 0+ .002 .015 0+ 2 .082 .185 .276 .312 .276 .185 .082 .015 .002 0+ 3 4 0+ .001 .015 .060 .138 .234 .311 .324 .246 .098 .031 .001 4 0+ 0+ .002 .010 .037 .094 .187 .303 .393 .354 .232 .057 5 0+ 0+ 0+ .001 .004 .016 .047 .118 .262 .531 .735 .941 7 .932 .698 .478 .210 .082 .028 .008 .002 0+ 0+ 0+ 0+ 0+ .066 .257 .372 .367 .247 .131 .055 .017 .004 0+ 0+ 2 .002 .041 .124 .275 .318 .261 .164 .077 .025 .004 0+ 0+ 2 3 0+ .004 .023 .115 .227 .290 .273 .194 .097 .029 .003 0+ 3 4 0+ .003 .029 .097 .194 .273 .290 .227 .115 .023 .004 4 0+ 0+ .004 .025 .077 .164 .261 .318 .275 .124 .041 .002 0+ 0+ 0+ .004 .017 .055 .131 .247 .367 .372 .257 .066 0+ 0+ 0+ 0+ .002 .008 .028 .082 .210 .478 .698 .932 .923 .663 .430 .168 .058 .017 .004 .001 0+ 0+ 0+ 0+ 0+ 1 .075 .279 .383 .336 .198 .090 .031 .008 .001 0+ 0+ 0+ +0 1 2 .003 .051 .149 .294 .296 .209 .109 .041 .010 .001 0+ 0+ 3 .005 .033 .147 .254 .279 .219 .124 .047 .009 0+ 0+ 3 4 0+ .005 .046 .136 .232 .273 .232 .136 .046 .005 4 0+ .009 .047 .124 .219 .279 .254 .147 .033 .005 0+ .001 .010 .041 .109 .209 .296 .294 .149 .051 .003 0+ 0+ .001 .008 .031 .090 .198 .336 .383 .279 .075 7 0+ .001 .004 .017 .058 .168 .430 .663 .923 8 NOTE: 0+ represents a positive probability value less than 0.0005. From Frederick C. Mosteller, Robert E. K. Rourke, and George B. Thomas, Jr., Probability with Statistical Applications, 2nd ed., © 1970. Reprinted and electronically reproduced by permission of Pearson Education, Inc., Upper Saddle River, New Jersey. 683 2. 3.

College Algebra
10th Edition
ISBN:9781337282291
Author:Ron Larson
Publisher:Ron Larson
Chapter8: Sequences, Series,and Probability
Section8.7: Probability
Problem 11ECP: A manufacturer has determined that a machine averages one faulty unit for every 500 it produces....
icon
Related questions
Topic Video
Question

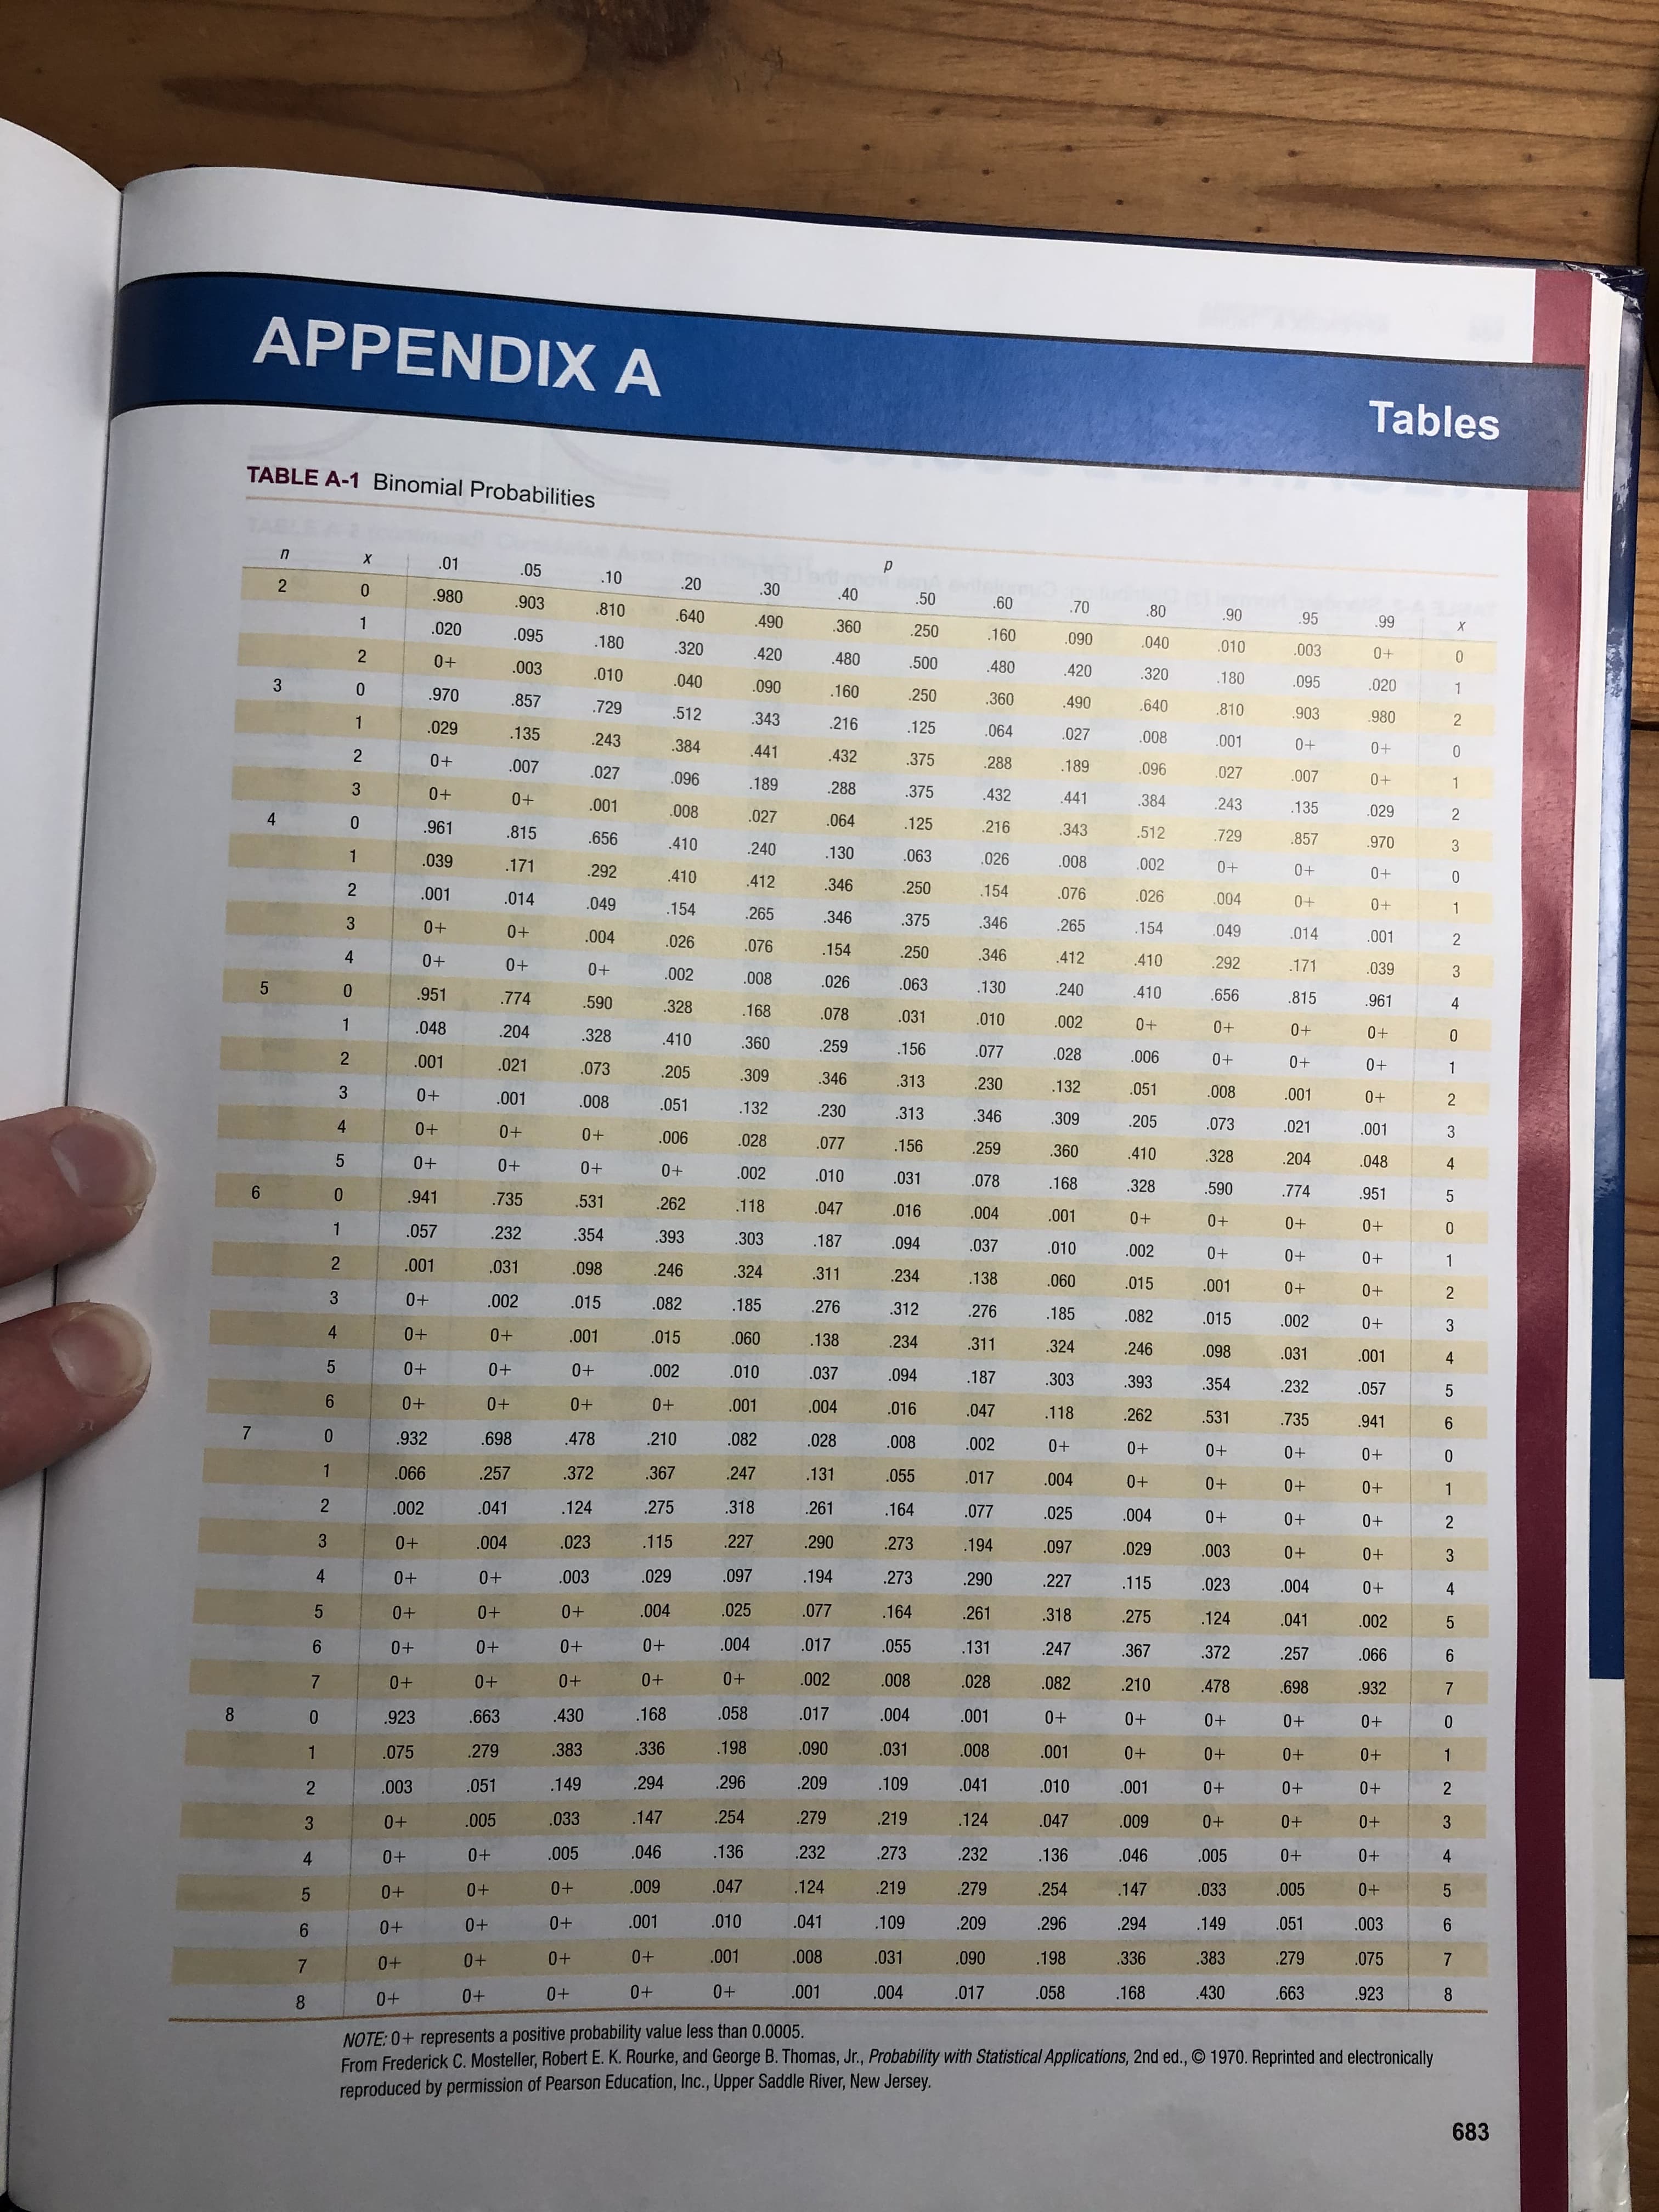
Using table A-1 for a Binomial Probability and given 8 trials, n = 8 and probability of success p = 0.20, find:

a) probability of x = exactly 7 successes

b) probability that x successes is fewer than 3

PLEASE SHOW ALL WORK!!!

APPENDIX A
Tables
TABLE A-1 Binomial Probabilities
.01
.05
.10
.20
.980
.30
.40
.50
.903
.810
.60
.70
.80
.640
.490
.90
.95
.99
.020
.095
.360
.250
.160
.180
.320
.090
.040
.010
.003
.420
.480
.500
.003
.010
.480
.420
.320
.040
.090
.180
.095
.020
.970
.857
.160
.250
.360
.490
.729
.512
.640
.810
.903
.029
.343
.216
.125
980
2
.135
.243
.064
.027
.008
.001
.384
.441
0+
0+
.007
.432
.375
.288
.189
.027
.096
.096
.027
.007
3
0+
.189
.288
.375
.432
1
0+
.001
.441
.384
.243
.135
4
.008
.027
.064
.029
.961
.815
.125
.216
.343
.512
.656
.410
.729
.857
.970
3
.240
.130
.063
.026
.039
.171
.008
.002
0+
.292
.410
412
0+
.001
.346
.250
.154
.076
.026
.014
.049
.004
.154
.265
.346
.375
1
3
0+
0+
.346
.265
.154
.049
.014
.004
.026
.076
.001
0+
.154
.250
.346
.412
.410
0+
.002
.292
.171
.039
3
.008
.026
.063
.130
.951
.774
.590
.240
.410
.656
.815
.961
.328
.168
.078
4
1
.031
.010
.002
0+
.048
.204
.328
0+
0+
.410
.360
.259
.156
.001
.077
.028
.006
0+
0+
.021
.073
.205
0+
1
.309
.346
.313
.230
3
0+
.132
.051
.008
.001
.001
.008
.051
.132
.230
.313
.346
4
0+
.309
.205
.073
.021
.001
0+
.006
.028
3
.077
.156
.259
.360
5
0+
0+
.410
.328
.204
.048
4
0+
0+
.002
.010
.031
.078
.168
.328
.590
.774
.941
.735
.531
.262
.118
.951
5
.047
.016
.004
.001
.057
.232
.354
.393
0+
.303
.187
.094
.037
.010
.002
0+
.001
.031
.098
.246
.324
.311
.234
.138
.060
.015
.001
+0
3
0+
.002
.015
0+
2
.082
.185
.276
.312
.276
.185
.082
.015
.002
0+
3
4
0+
.001
.015
.060
.138
.234
.311
.324
.246
.098
.031
.001
4
0+
0+
.002
.010
.037
.094
.187
.303
.393
.354
.232
.057
5
0+
0+
0+
.001
.004
.016
.047
.118
.262
.531
.735
.941
7
.932
.698
.478
.210
.082
.028
.008
.002
0+
0+
0+
0+
0+
.066
.257
.372
.367
.247
.131
.055
.017
.004
0+
0+
2
.002
.041
.124
.275
.318
.261
.164
.077
.025
.004
0+
0+
2
3
0+
.004
.023
.115
.227
.290
.273
.194
.097
.029
.003
0+
3
4
0+
.003
.029
.097
.194
.273
.290
.227
.115
.023
.004
4
0+
0+
.004
.025
.077
.164
.261
.318
.275
.124
.041
.002
0+
0+
0+
.004
.017
.055
.131
.247
.367
.372
.257
.066
0+
0+
0+
0+
.002
.008
.028
.082
.210
.478
.698
.932
.923
.663
.430
.168
.058
.017
.004
.001
0+
0+
0+
0+
0+
1
.075
.279
.383
.336
.198
.090
.031
.008
.001
0+
0+
0+
+0
1
2
.003
.051
.149
.294
.296
.209
.109
.041
.010
.001
0+
0+
3
.005
.033
.147
.254
.279
.219
.124
.047
.009
0+
0+
3
4
0+
.005
.046
.136
.232
.273
.232
.136
.046
.005
4
0+
.009
.047
.124
.219
.279
.254
.147
.033
.005
0+
.001
.010
.041
.109
.209
.296
.294
.149
.051
.003
0+
0+
.001
.008
.031
.090
.198
.336
.383
.279
.075
7
0+
.001
.004
.017
.058
.168
.430
.663
.923
8
NOTE: 0+ represents a positive probability value less than 0.0005.
From Frederick C. Mosteller, Robert E. K. Rourke, and George B. Thomas, Jr., Probability with Statistical Applications, 2nd ed., © 1970. Reprinted and electronically
reproduced by permission of Pearson Education, Inc., Upper Saddle River, New Jersey.
683
2.
3.
Transcribed Image Text:APPENDIX A Tables TABLE A-1 Binomial Probabilities .01 .05 .10 .20 .980 .30 .40 .50 .903 .810 .60 .70 .80 .640 .490 .90 .95 .99 .020 .095 .360 .250 .160 .180 .320 .090 .040 .010 .003 .420 .480 .500 .003 .010 .480 .420 .320 .040 .090 .180 .095 .020 .970 .857 .160 .250 .360 .490 .729 .512 .640 .810 .903 .029 .343 .216 .125 980 2 .135 .243 .064 .027 .008 .001 .384 .441 0+ 0+ .007 .432 .375 .288 .189 .027 .096 .096 .027 .007 3 0+ .189 .288 .375 .432 1 0+ .001 .441 .384 .243 .135 4 .008 .027 .064 .029 .961 .815 .125 .216 .343 .512 .656 .410 .729 .857 .970 3 .240 .130 .063 .026 .039 .171 .008 .002 0+ .292 .410 412 0+ .001 .346 .250 .154 .076 .026 .014 .049 .004 .154 .265 .346 .375 1 3 0+ 0+ .346 .265 .154 .049 .014 .004 .026 .076 .001 0+ .154 .250 .346 .412 .410 0+ .002 .292 .171 .039 3 .008 .026 .063 .130 .951 .774 .590 .240 .410 .656 .815 .961 .328 .168 .078 4 1 .031 .010 .002 0+ .048 .204 .328 0+ 0+ .410 .360 .259 .156 .001 .077 .028 .006 0+ 0+ .021 .073 .205 0+ 1 .309 .346 .313 .230 3 0+ .132 .051 .008 .001 .001 .008 .051 .132 .230 .313 .346 4 0+ .309 .205 .073 .021 .001 0+ .006 .028 3 .077 .156 .259 .360 5 0+ 0+ .410 .328 .204 .048 4 0+ 0+ .002 .010 .031 .078 .168 .328 .590 .774 .941 .735 .531 .262 .118 .951 5 .047 .016 .004 .001 .057 .232 .354 .393 0+ .303 .187 .094 .037 .010 .002 0+ .001 .031 .098 .246 .324 .311 .234 .138 .060 .015 .001 +0 3 0+ .002 .015 0+ 2 .082 .185 .276 .312 .276 .185 .082 .015 .002 0+ 3 4 0+ .001 .015 .060 .138 .234 .311 .324 .246 .098 .031 .001 4 0+ 0+ .002 .010 .037 .094 .187 .303 .393 .354 .232 .057 5 0+ 0+ 0+ .001 .004 .016 .047 .118 .262 .531 .735 .941 7 .932 .698 .478 .210 .082 .028 .008 .002 0+ 0+ 0+ 0+ 0+ .066 .257 .372 .367 .247 .131 .055 .017 .004 0+ 0+ 2 .002 .041 .124 .275 .318 .261 .164 .077 .025 .004 0+ 0+ 2 3 0+ .004 .023 .115 .227 .290 .273 .194 .097 .029 .003 0+ 3 4 0+ .003 .029 .097 .194 .273 .290 .227 .115 .023 .004 4 0+ 0+ .004 .025 .077 .164 .261 .318 .275 .124 .041 .002 0+ 0+ 0+ .004 .017 .055 .131 .247 .367 .372 .257 .066 0+ 0+ 0+ 0+ .002 .008 .028 .082 .210 .478 .698 .932 .923 .663 .430 .168 .058 .017 .004 .001 0+ 0+ 0+ 0+ 0+ 1 .075 .279 .383 .336 .198 .090 .031 .008 .001 0+ 0+ 0+ +0 1 2 .003 .051 .149 .294 .296 .209 .109 .041 .010 .001 0+ 0+ 3 .005 .033 .147 .254 .279 .219 .124 .047 .009 0+ 0+ 3 4 0+ .005 .046 .136 .232 .273 .232 .136 .046 .005 4 0+ .009 .047 .124 .219 .279 .254 .147 .033 .005 0+ .001 .010 .041 .109 .209 .296 .294 .149 .051 .003 0+ 0+ .001 .008 .031 .090 .198 .336 .383 .279 .075 7 0+ .001 .004 .017 .058 .168 .430 .663 .923 8 NOTE: 0+ represents a positive probability value less than 0.0005. From Frederick C. Mosteller, Robert E. K. Rourke, and George B. Thomas, Jr., Probability with Statistical Applications, 2nd ed., © 1970. Reprinted and electronically reproduced by permission of Pearson Education, Inc., Upper Saddle River, New Jersey. 683 2. 3.
Expert Solution
trending now

Trending now

This is a popular solution!

steps

Step by step

Solved in 3 steps with 4 images

Blurred answer
Knowledge Booster
Discrete Probability Distributions
Learn more about
Need a deep-dive on the concept behind this application? Look no further. Learn more about this topic, statistics and related others by exploring similar questions and additional content below.
Recommended textbooks for you
College Algebra
College Algebra
Algebra
ISBN:
9781337282291
Author:
Ron Larson
Publisher:
Cengage Learning
College Algebra
College Algebra
Algebra
ISBN:
9781938168383
Author:
Jay Abramson
Publisher:
OpenStax