APPLY THE CONCEPTS: Effect of Changes to Sales Price, Variable Costs and Fixed Costs Now consider each of the following scenarios for Gordon Products. Calculate the contribution margin (CM) per unit, rounded to nearest dollar, and the new break-even point in units, rounded to the nearest whole unit, for each scenario separately. Scenario 1 Scenario 2 Scenario 3 Gordon will dispose of a machine in the factory. The depreciation on that equipment is $500 per month. After some extensive market research, Gordon has determined that a sales price
APPLY THE CONCEPTS: Effect of Changes to Sales Price, Variable Costs and Fixed Costs Now consider each of the following scenarios for Gordon Products. Calculate the contribution margin (CM) per unit, rounded to nearest dollar, and the new break-even point in units, rounded to the nearest whole unit, for each scenario separately. Scenario 1 Scenario 2 Scenario 3 Gordon will dispose of a machine in the factory. The depreciation on that equipment is $500 per month. After some extensive market research, Gordon has determined that a sales price

Managerial Accounting
15th Edition
ISBN:9781337912020
Author:Carl Warren, Ph.d. Cma William B. Tayler
Publisher:Carl Warren, Ph.d. Cma William B. Tayler
Chapter6: Cost-volume-profit Analysis
Section: Chapter Questions
Problem 18E

Related questions
Question
APPLY THE CONCEPTS: Effect of Changes to Sales Price, Variable Costs and Fixed Costs
Now consider each of the following scenarios for Gordon Products. Calculate the contribution margin (CM) per unit, rounded to nearest dollar, and the new break-even point in units, rounded to the nearest whole unit, for each scenario separately.
| Scenario 1 | Scenario 2 | Scenario 3 |
| Gordon will dispose of a machine in the factory. The |
After some extensive |
Gordon has been experiencing quality problems with a materials supplier. Changing suppliers will improve the quality of the product but will cause direct materials costs to increase by $1 per unit. |
| CM per unit: $fill in the blank e2f800fbc041002_1 | CM per unit: $fill in the blank e2f800fbc041002_2 | CM per unit: $fill in the blank e2f800fbc041002_3 |
| Break-even units: fill in the blank e2f800fbc041002_4 units | Break-even units: fill in the blank e2f800fbc041002_5 units | Break-even units: fill in the blank e2f800fbc041002_6 units |
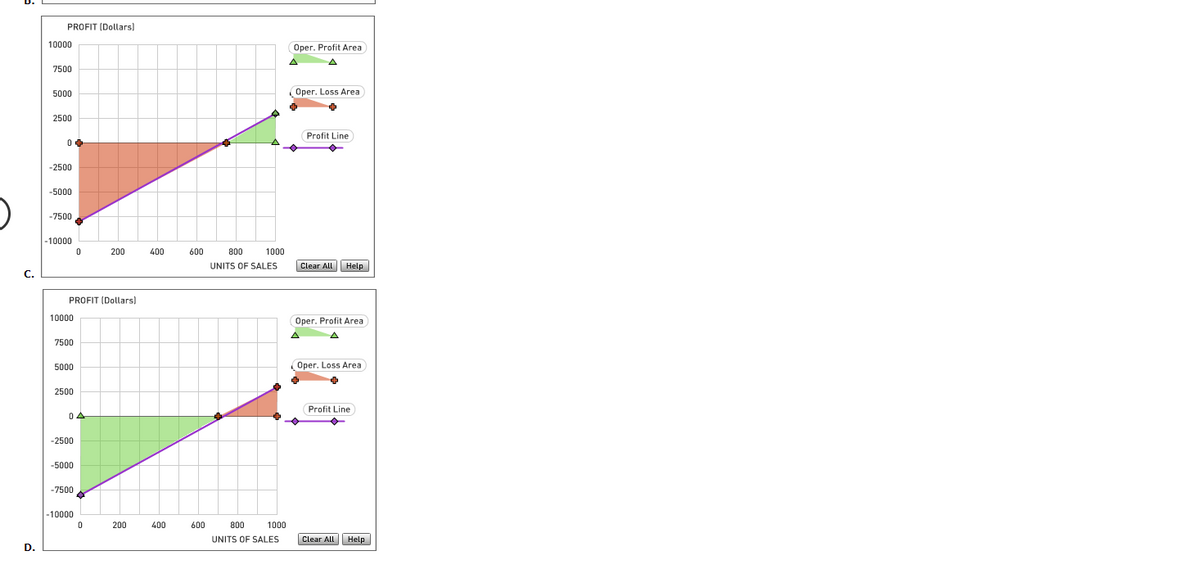
Transcribed Image Text:PROFIT (Dollars)
10000
Oper. Profit Area
7500
5000
Oper. Loss Area
2500
Profit Line
-2500
-5000
-7500
-10000
200
400
600
800
1000
UNITS OF SALES
Clear All Help
C.
PROFIT (Dollars)
10000
Oper. Profit Area
A
7500
5000
Oper. Loss Area
2500
Profit Line
-2500
-5000
-7500
-10000
200
400
600
800
1000
UNITS OF SALES
Clear All Help
D.
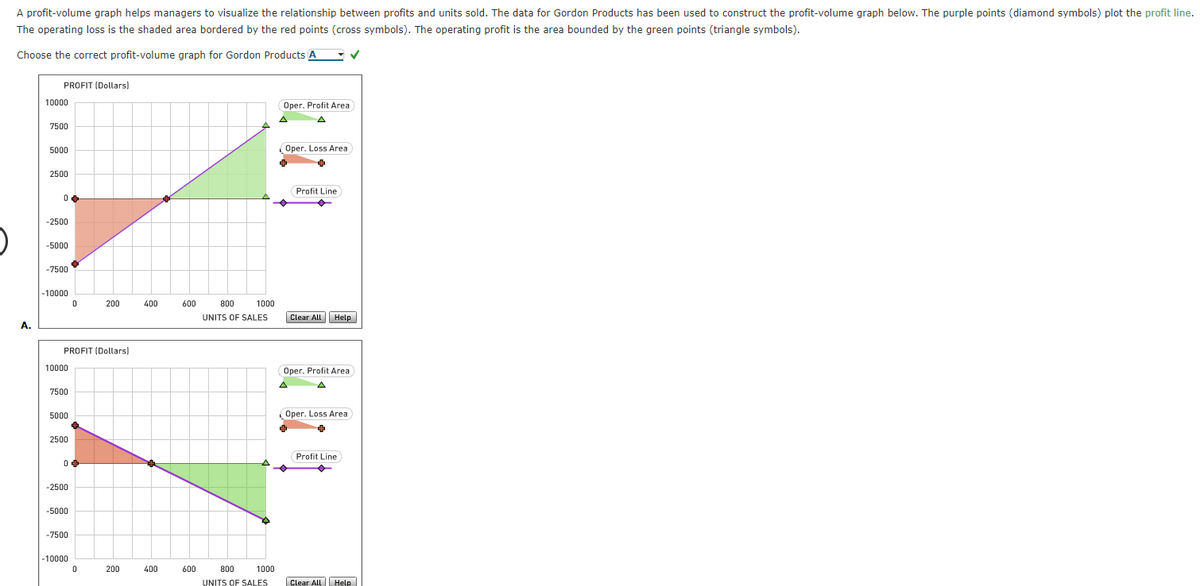
Transcribed Image Text:A profit-volume graph helps managers to visualize the relationship between profits and units sold. The data for Gordon Products has been used to construct the profit-volume graph below. The purple points (diamond symbols) plot the profit line.
The operating loss is the shaded area bordered by the red points (cross symbols). The operating profit is the area bounded by the green points (triangle symbols).
Choose the correct profit-volume graph for Gordon Products A
PROFIT (Dollars)
10000
Oper. Profit Area
7500
5000
Oper. Loss Area
2500
Profit Line
-2500
-5000
-7500
-10000
200
400
600
800
1000
UNITS OF SALES
Clear All Help
A.
PROFIT (Dollars)
10000
Oper. Profit Area
7500
5000
Oper. Loss Area
2500
Profit Line
04
-2500
-5000
-7500
-10000
200
400
600
800
1000
UNITS OF SALES
Clear All Help
Expert Solution
This question has been solved!
Explore an expertly crafted, step-by-step solution for a thorough understanding of key concepts.

This is a popular solution!

Trending now
This is a popular solution!

Step by step
Solved in 2 steps

Knowledge Booster


Learn more about
Need a deep-dive on the concept behind this application? Look no further. Learn more about this topic, accounting and related others by exploring similar questions and additional content below.Recommended textbooks for you
Managerial Accounting
Accounting
ISBN:
9781337912020
Author:
Carl Warren, Ph.d. Cma William B. Tayler
Publisher:
South-Western College Pub

Financial And Managerial Accounting
Accounting
ISBN:
9781337902663
Author:
WARREN, Carl S.
Publisher:
Cengage Learning,

Financial Reporting, Financial Statement Analysis…
Finance
ISBN:
9781285190907
Author:
James M. Wahlen, Stephen P. Baginski, Mark Bradshaw
Publisher:
Cengage Learning
Managerial Accounting
Accounting
ISBN:
9781337912020
Author:
Carl Warren, Ph.d. Cma William B. Tayler
Publisher:
South-Western College Pub
Financial And Managerial Accounting
Accounting
ISBN:
9781337902663
Author:
WARREN, Carl S.
Publisher:
Cengage Learning,
Financial Reporting, Financial Statement Analysis…
Finance
ISBN:
9781285190907
Author:
James M. Wahlen, Stephen P. Baginski, Mark Bradshaw
Publisher:
Cengage Learning

Cornerstones of Cost Management (Cornerstones Ser…
Accounting
ISBN:
9781305970663
Author:
Don R. Hansen, Maryanne M. Mowen
Publisher:
Cengage Learning

Managerial Accounting: The Cornerstone of Busines…
Accounting
ISBN:
9781337115773
Author:
Maryanne M. Mowen, Don R. Hansen, Dan L. Heitger
Publisher:
Cengage Learning

Intermediate Financial Management (MindTap Course…
Finance
ISBN:
9781337395083
Author:
Eugene F. Brigham, Phillip R. Daves
Publisher:
Cengage Learning