Arandom sample of 17 observations taken from a population that is normally distributed produced a sample mean of 42.4 and a standard deviation of 8. Find the range for the p-value and the critical and observed values of t for each of the following tests of hypotheses using, a = 0.01. Use the t distribution table to find a range for the p-value. Round your answers for the values of t to three decimal places. a. Ho: µ = 46 versus H1: µ < 46. i ! < p-value < i tcritical i -2.583 tobserved -1.856 %3D b. Ho: µ = 46 versus H1: µ 46. i < p-value < II
Arandom sample of 17 observations taken from a population that is normally distributed produced a sample mean of 42.4 and a standard deviation of 8. Find the range for the p-value and the critical and observed values of t for each of the following tests of hypotheses using, a = 0.01. Use the t distribution table to find a range for the p-value. Round your answers for the values of t to three decimal places. a. Ho: µ = 46 versus H1: µ < 46. i ! < p-value < i tcritical i -2.583 tobserved -1.856 %3D b. Ho: µ = 46 versus H1: µ 46. i < p-value < II

Algebra: Structure And Method, Book 1
(REV)00th Edition
ISBN:9780395977224
Author:Richard G. Brown, Mary P. Dolciani, Robert H. Sorgenfrey, William L. Cole
Publisher:Richard G. Brown, Mary P. Dolciani, Robert H. Sorgenfrey, William L. Cole
Chapter12: Quadratic Functions
Section12.6: Solving Problems Involving Quadratic Equations
Problem 1.3E

Related questions
Question
I only got some of it right. My professor told me i got the redt wrong. I have left blank what i need help on.
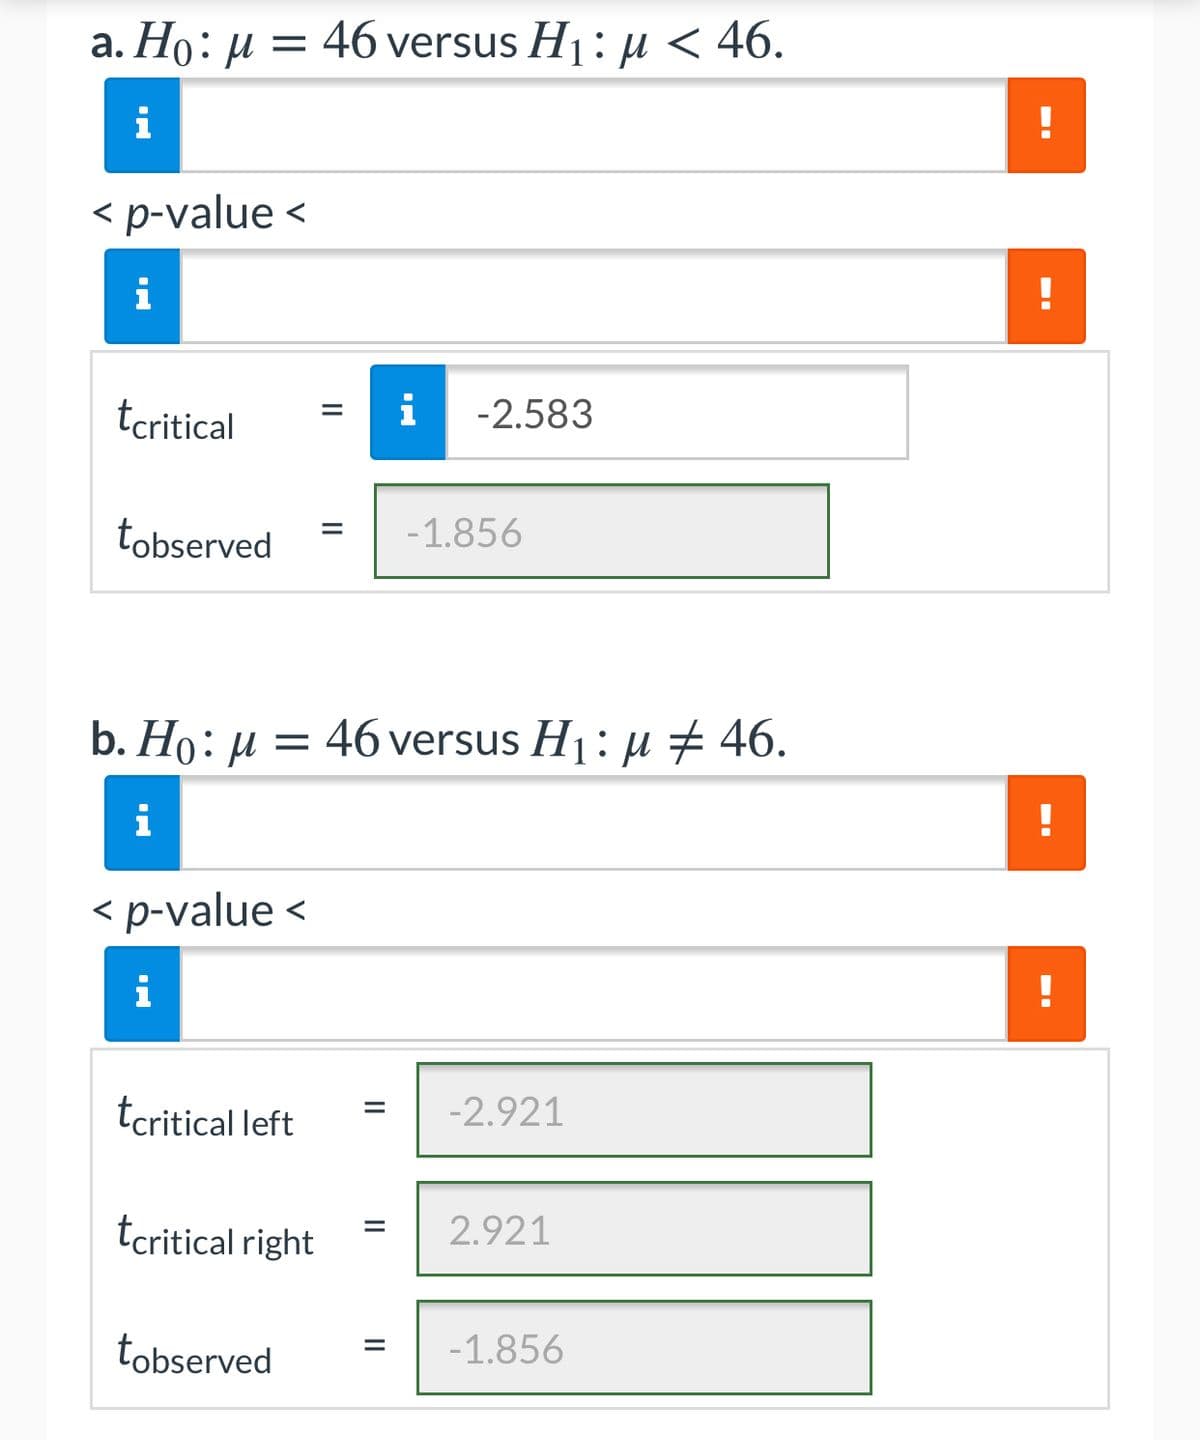
Transcribed Image Text:a. Ho: µ = 46 versus H1: µu < 46.
i
< p-value <
tcritical
i
-2.583
%D
tobserved
-1.856
b. Ho: µ = 46 versus H1: µ + 46.
i
< p-value <
i
tcritical left
-2.921
tcritical right
2.921
tobserved
-1.856
II
II
II
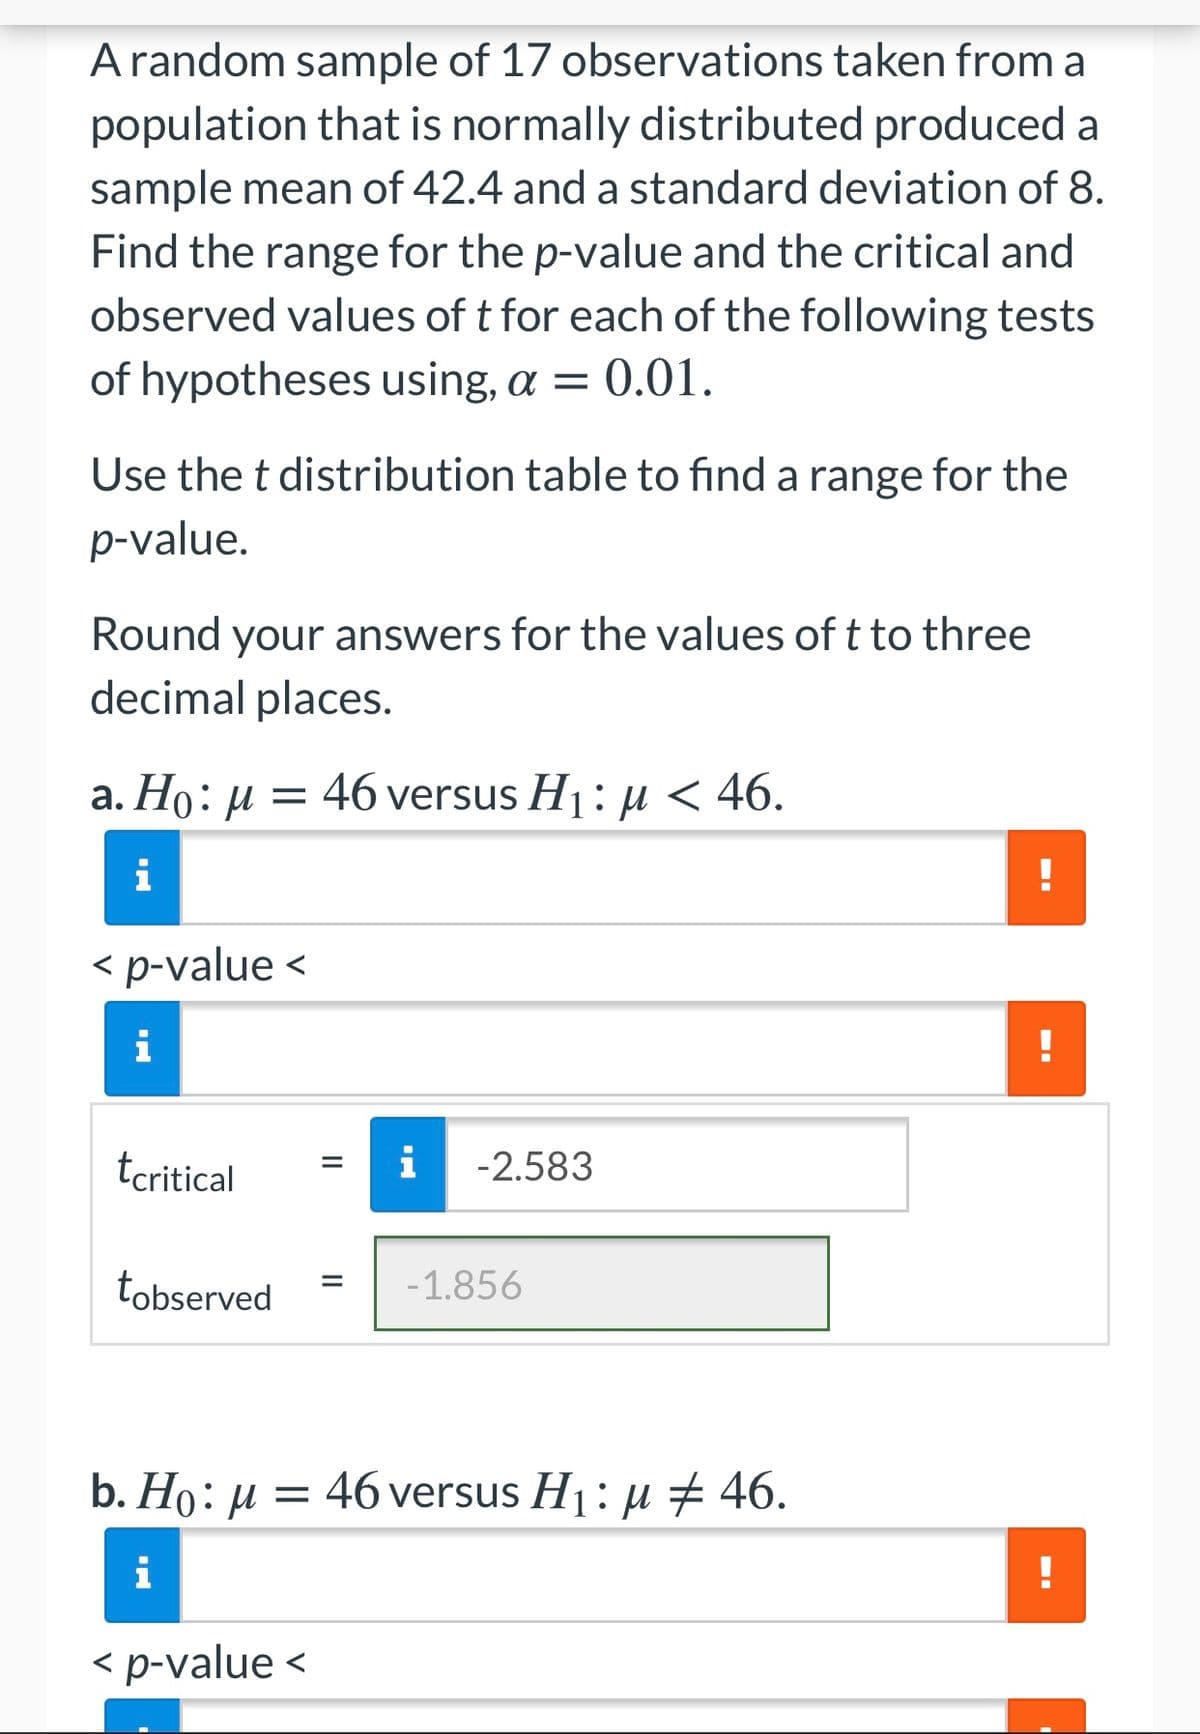
Transcribed Image Text:A random sample of 17 observations taken from a
population that is normally distributed produced a
sample mean of 42.4 and a standard deviation of 8.
Find the range for the p-value and the critical and
observed values of t for each of the following tests
of hypotheses using, a = 0.01.
Use the t distribution table to find a range for the
p-value.
Round your answers for the values of t to three
decimal places.
a. Ho: µ = 46 versus H1 : H < 46.
i
!
< p-value <
i
!
tcritical
i
-2.583
tobserved
-1.856
b. Hо: и
46 versus H1: µ # 46.
i
< p-value <
Expert Solution
This question has been solved!
Explore an expertly crafted, step-by-step solution for a thorough understanding of key concepts.

This is a popular solution!

Trending now
This is a popular solution!

Step by step
Solved in 2 steps with 2 images

Knowledge Booster


Learn more about
Need a deep-dive on the concept behind this application? Look no further. Learn more about this topic, probability and related others by exploring similar questions and additional content below.Recommended textbooks for you
Algebra: Structure And Method, Book 1
Algebra
ISBN:
9780395977224
Author:
Richard G. Brown, Mary P. Dolciani, Robert H. Sorgenfrey, William L. Cole
Publisher:
McDougal Littell

Mathematics For Machine Technology
Advanced Math
ISBN:
9781337798310
Author:
Peterson, John.
Publisher:
Cengage Learning,

Algebra: Structure And Method, Book 1
Algebra
ISBN:
9780395977224
Author:
Richard G. Brown, Mary P. Dolciani, Robert H. Sorgenfrey, William L. Cole
Publisher:
McDougal Littell
Mathematics For Machine Technology
Advanced Math
ISBN:
9781337798310
Author:
Peterson, John.
Publisher:
Cengage Learning,

Elementary Geometry for College Students
Geometry
ISBN:
9781285195698
Author:
Daniel C. Alexander, Geralyn M. Koeberlein
Publisher:
Cengage Learning

Glencoe Algebra 1, Student Edition, 9780079039897…
Algebra
ISBN:
9780079039897
Author:
Carter
Publisher:
McGraw Hill